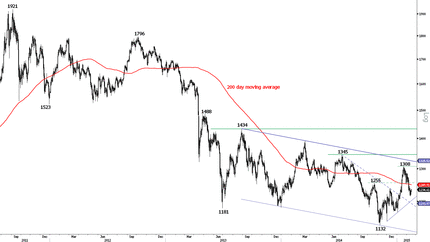
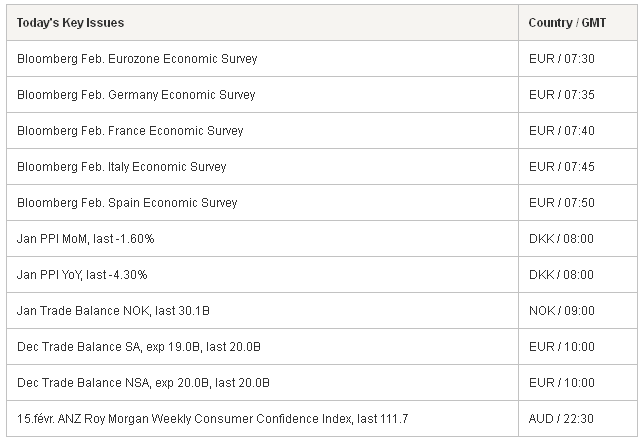
Only the BoJ in the G10 with policy meeting this week FX traders will be focused on Greece headlines and latest meeting minutes from RBA, BoE and Fed. Markets will also focus on the latest ECB decision on ELA access on the 18th. Commodities remain the big story as brent rose above $60 for the first time this year, driven by the decent European economic data and news that suppliers investment spending would decrease. Oil currencies such as NOK, CAD and RUB should further benefit from higher energy costs. Gold’s recovery has falter but with the Riksbank starting mini QE and Japanese weak GDP indicating further easing will be required giving Gold further upside. Also, data from IMM indicates that widespread Gold long liquidations will lossen upside. The cease-fire agreement between Russia and the Ukraine kicked-off creating tentative optimism (despite areas of enduring fighting) also supporting the positive sentiment. Potentially providing momentum for further upside in European stocks. In addition, Fridays pullback in European rates suggests that the concern around Greece and optimism around German economic data could support further risk appetite. With the US market on holiday for Presidents day, liquidity will be thin and focused on news souring the Greek bailout discussion.
Well here we are again, at the edge of the precipice and wouldn’t you know it Greece is the catalyst. Today Eurogroup will resume talks, but on a detailed level, to try to find a solution to the Greek insolvency issue. While market expects a short term solution (illustrated by lack of contagion in the financial markets) we remain cautions as a few participants including German continue to play hardball. Markets are expecting an agreement that would enable a extension of the program for a few months or allow Greece to issue additional short term debt. Either solution would permit the Europeans strategy of “kicking the can” down the road to reduce uncertainty and help risky assets. European and Greek discussion broke down last Wednesday as the divide between policymakers remained to wide. Since then there have been some softening of hard-stance on both side. Yet worringly, the core blocking issues are unchanged. Europe wants Greece to honor its commitments under the existing bailout program while Syriza leader and prime minister Alexis Tsipras views as unacceptable. With a strong mandate from Greek people he is looking to renegotiate roughly 30% of the aid programs terms. Concerningly Tsipras main campaign promise was to not ask of any extension to the current €240bn bailout package (plus a debt write-down worth more than €100 billion).
In this eco-political drama events are fluid and outcome far from certain. Yet last week two pieces of economic data have come to light which could forces the Greek hand. First is official Greek economic data that government tax receipts fell one billion euro below expectations. It had been rumored that ordinary Greeks are withholding paying taxes due to the local political environment. And not helped by Tsipras promise to cut property taxes and reinstate €12,000 tax free allowance. This means that Greece will run out of money 20% faster than previously expected. Second, GDP figures release showed Greece’s economy contracted in Q4 2014. Perhaps the biggest player to emerge in this act of Euro drama has been the ECB. Their decision to raise the threshold for bond buying and not allowing Greece to issue bright financing of roughly €10bn has pushed Greece to compromise. With Greeks current debt rescue plan expiring at the end of Feb, the ECB has signaled that it will not offer Greece cheap funding to keep its fragile banking system afloat. Only a agreement between Greece and its creditors will open this capital tap. We remain bullish on the USD in the longer term but concede that overbought condition and resolution to Greek insolvency could lead to a sizable pullback. In the G10 we suspect that the NZD, AUD, SEK and BRL, RUB, KRW have the highest probably of near term improvement against the USD. In addition, yield starved investors will always look to pick up carry should uncertainty decrease. That said, conditions remain fluid as investors await more clarity.


The Risk Today
Peter Rosenstreich
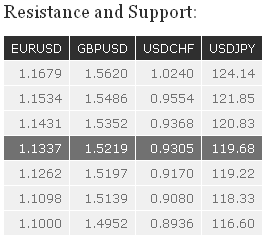
EUR/USD EUR/USD has broken both the hourly resistance at 1.1359 and its short-term declining trendline, which improves the short-term technical structure. A move towards the resistance at 1.1534 is likely. An hourly resistance now lies at 1.1443 (13/02/2015 high). Hourly supports can be found at 1.1380 (13/12/2015 low) and 1.1262. In the longer term, the symmetrical triangle favours further weakness towards parity. As a result, any strength is likely to be temporary in nature. Key resistances stand at 1.1679 (21/01/2015 high) and 1.1871 (12/01/2015 high). Key supports can be found at 1.1000 (psychological support) and 1.0765 (03/09/2003 low).
GBP/USD GBP/USD has broken the key resistance at 1.5274 (06/01/2015 high) and the declining trendline, indicating an improving technical structure. Resistances can be found at 1.5486 and 1.5620. Hourly supports are given by 1.5343 (intraday low) and by the rising trendline (around 1.5273). In the longer term, the break of the key resistance at 1.5274 (06/01/2015 high) suggests renewed buying interest. Upside potentials are likely given by the resistances at 1.5620 (31/12/2014 high) and 1.5826 (27/11/2014 high). A strong support stands at 1.4814.
USD/JPY USD/JPY has sharply declined near the resistance area between 120.83 and 121.85. Further medium-term sideways moves are favoured. The support at 118.83 has been breached. Another hourly support is given by the rising trendline (around 117.44). An hourly resistance can now be found at 119.20 (13/02/2015 high). A long-term bullish bias is favoured as long as the key support 110.09 (01/10/2014 high) holds. Even if a medium-term consolidation is likely underway, there is no sign to suggest the end of the long-term bullish trend. A gradual rise towards the major resistance at 124.14 (22/06/2007 high) is favoured. A key support can be found at 115.57 (16/12/2014 low).
USD/CHF USD/CHF is consolidating below the resistance at 0.9347/0.9368 (15/10/2014 low, see also the 200-day moving average). The short-term succession of higher lows favours a bullish bias. Hourly supports stand at 0.9257 (12/02/2015 low) and 0.9170 (30/01/2015 low). Another resistance lies at 0.9554 (16/12/2014 low). Following the removal of the EUR/CHF floor, a major top has been formed at 1.0240. The break of the resistance implied by the 61.8% retracement of the sell-off suggests a strong buying interest. Another key resistance stands at 0.9554 (16/12/2014 low), whereas a strong support can be found at 0.8353 (intraday low).

