The S&P 500 has not experienced a 10% correction since October 3, 2011. That’s a heck of run without a reality check.
Yet, according to the researchers at Bespoke Investment Group, 515 trading sessions without a serious sell-off is not unprecedented. The S&P 500 rocketed ahead throughout the 90s (10/90-10/97) as well as in the 2000s (3/03-10/07) bull without a 10% price cut. The conclusion that many analysts are drawing from the data is that there is little reason to sweat the absence of a sanity-restoring setback.
Is there a problem with documenting occasions when markets pressed forward for multiple years without a hitch? Absolutely. For one thing, we’re ignoring the number of occasions when markets did the opposite; that is, since 1928, the S&P 500 sold off by 10% in an overwhelming majority of years. Indeed, it is quite unusual for a 1990s- or 2000s-style campaign. Secondly, both of those campaigns ended with irrational exuberance giving way to -50% life-altering buzz cuts.
This is not to suggest that stocks will fail to grind higher in the intermediate-term. They probably will. Ultra-slow employment gains coupled with U.S. political dysfunction ensure that the U.S. Federal Reserve will keep pumping greenbacks into the world’s financial system. And let’s face it… keeping yields low is the key to the revival of risk-on investing.
That said, should investors embrace history when the data are technical (i.e., # of trading days without a 10% correction), but ignore history when the data are fundamental? For example, European stocks typically trade at similar price-to-earnings ratios as U.S. counterparts. Right now, though, SPDR Europe STOXX 50 (FEZ) is roughly 15% “cheaper” than SPDR S&P 500 (SPY); Vanguard All World (VEU) trades at an approximate 20% discount to SPY.
There are other “fun facts” from the fundamental file as well. Between 1940 and 1995, the S&P 500’s price-to-revenue ratio did not surpass 1.5. The P/S ratio for the S&P 500 today stands at 1.6. Worse yet, sales growth at U.S. corporations in the benchmark averaged a meager 3% in the previous four quarters. In the current environment where we have weak revenue growth — in a historical framework where price-to-sales ratios are rarely this elevated — perhaps it is more sensible to to consider international stock ETFs with lower P/S ratios.
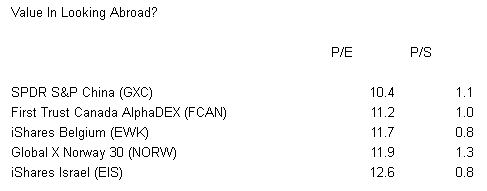
Using a recent screen at Morningstar, here are 5 international ETFs with lower P/Es and lower P/S ratios than the S&P 500 SPDR Trust (SPY):
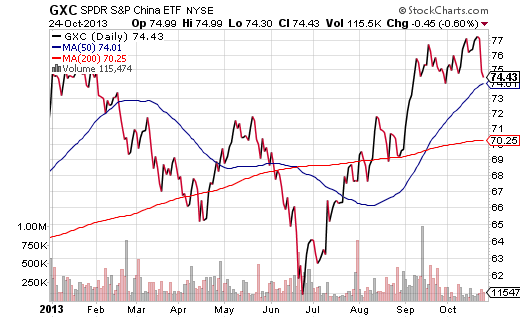
The world’s 2nd largest economy may have a number of structural issues. Nevertheless, consumption by China’s middle class is rising and the country’s expansion remains on track. SPDR S&P China (GXC) is a reasonable way to tap into the growth.
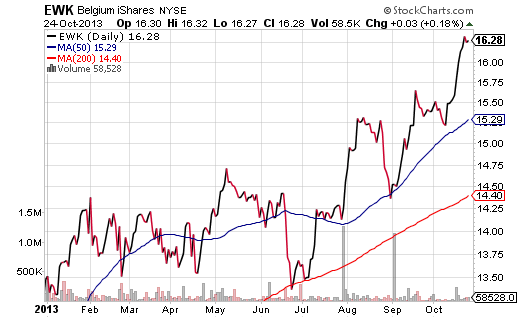
Belgium may also be a bargain. The iShares Belgium Fund (EWK) bounced off its 200-day trendline in June and hasn’t looked back since. Granted, EWK is likely to travel in the same general direction as other foreign stocks in the region. Still, the relative affordability combined with recent 1-month and 3-month momentum may make EWK particularly profitable.
You can select a diversified approach to adding international exposure through funds such as Vanguard All-World (VEU) and/or iShares MSCI EAFE Small Cap (SCZ). Conversely, you can choose individual countries through single country funds like SPDR S&P China (GXC) and/or iShares MSCI Belgium (EWK). Regardless, you must be steadfast in your commitment to downside protection. Utilize a method for minimizing downside risk (e.g., stop-limit loss orders, hedges, trend analysis, etc.) and stick to it.
Disclosure: Gary Gordon, MS, CFP is the president of Pacific Park Financial, Inc., a Registered Investment Adviser with the SEC. Gary Gordon, Pacific Park Financial, Inc, and/or its clients may hold positions in the ETFs, mutual funds, and/or any investment asset mentioned above. The commentary does not constitute individualized investment advice. The opinions offered herein are not personalized recommendations to buy, sell or hold securities. At times, issuers of exchange-traded products compensate Pacific Park Financial, Inc. or its subsidiaries for advertising at the ETF Expert web site. ETF Expert content is created independently of any advertising relationships.
- English (UK)
- English (India)
- English (Canada)
- English (Australia)
- English (South Africa)
- English (Philippines)
- English (Nigeria)
- Deutsch
- Español (España)
- Español (México)
- Français
- Italiano
- Nederlands
- Português (Portugal)
- Polski
- Português (Brasil)
- Русский
- Türkçe
- العربية
- Ελληνικά
- Svenska
- Suomi
- עברית
- 日本語
- 한국어
- 简体中文
- 繁體中文
- Bahasa Indonesia
- Bahasa Melayu
- ไทย
- Tiếng Việt
- हिंदी
Risk-On Investing? International ETFs May Be More Profitable
Published 10/25/2013, 02:58 AM
Risk-On Investing? International ETFs May Be More Profitable
Latest comments
Loading next article…
Install Our App
Risk Disclosure: Trading in financial instruments and/or cryptocurrencies involves high risks including the risk of losing some, or all, of your investment amount, and may not be suitable for all investors. Prices of cryptocurrencies are extremely volatile and may be affected by external factors such as financial, regulatory or political events. Trading on margin increases the financial risks.
Before deciding to trade in financial instrument or cryptocurrencies you should be fully informed of the risks and costs associated with trading the financial markets, carefully consider your investment objectives, level of experience, and risk appetite, and seek professional advice where needed.
Fusion Media would like to remind you that the data contained in this website is not necessarily real-time nor accurate. The data and prices on the website are not necessarily provided by any market or exchange, but may be provided by market makers, and so prices may not be accurate and may differ from the actual price at any given market, meaning prices are indicative and not appropriate for trading purposes. Fusion Media and any provider of the data contained in this website will not accept liability for any loss or damage as a result of your trading, or your reliance on the information contained within this website.
It is prohibited to use, store, reproduce, display, modify, transmit or distribute the data contained in this website without the explicit prior written permission of Fusion Media and/or the data provider. All intellectual property rights are reserved by the providers and/or the exchange providing the data contained in this website.
Fusion Media may be compensated by the advertisers that appear on the website, based on your interaction with the advertisements or advertisers.
© 2007-2025 - Fusion Media Limited. All Rights Reserved.
