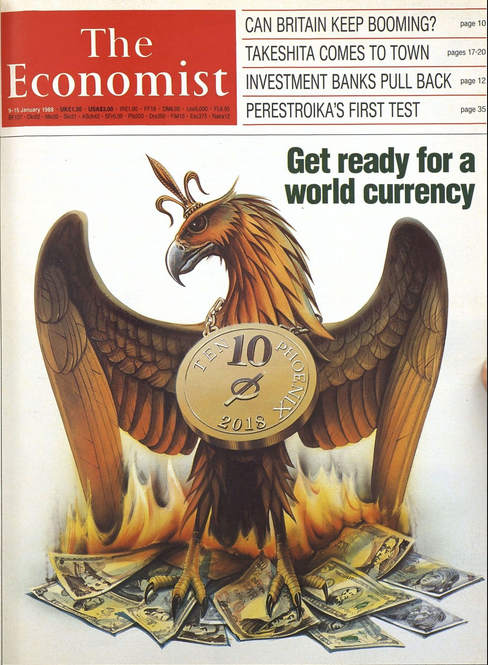
Thirty years ago The Economist magazine ran a story that began with the words "thirty years from now."
It then proceeded to predict the rise of a new world currency. On the cover of that magazine was a picture of a Pheonix standing on top of a pile of burning fiat money.
Today's Highlights
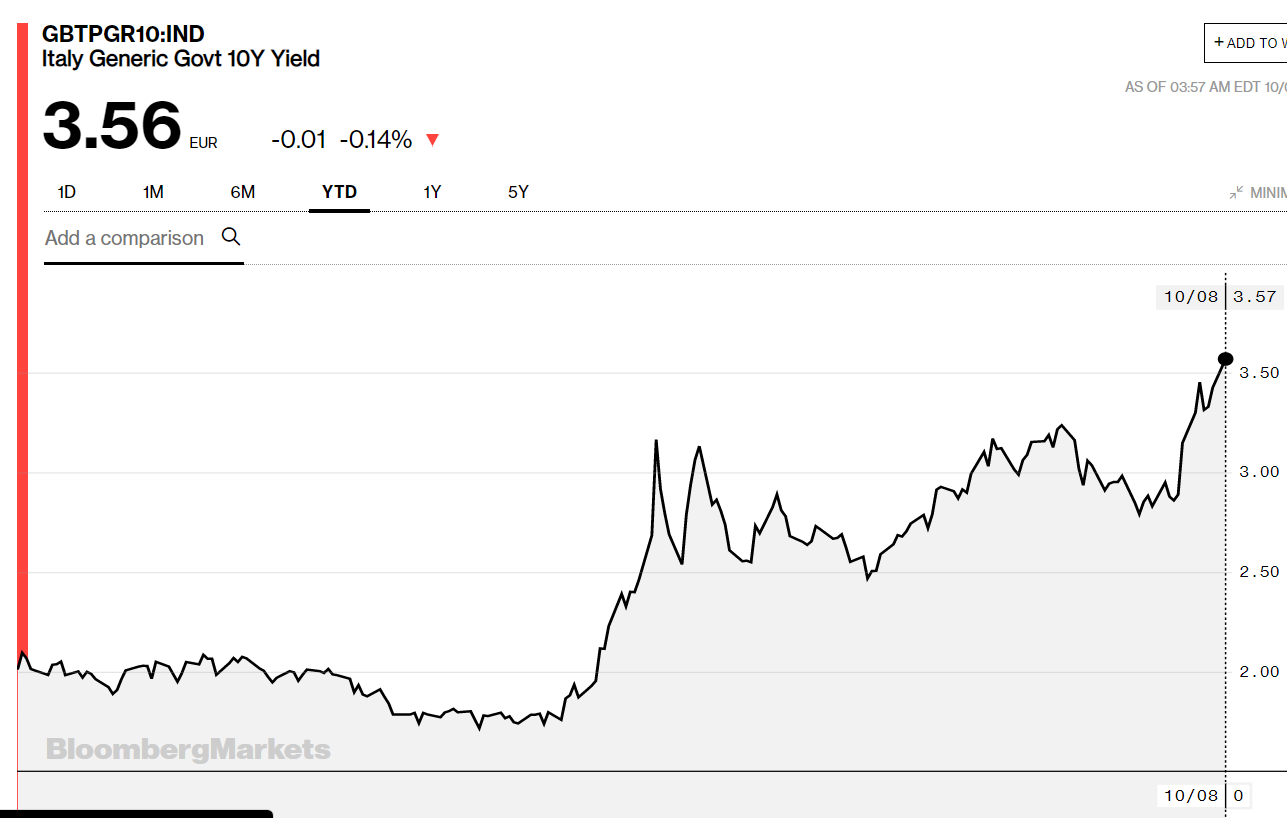
Eyes on Bonds
Minus Google plus
Bitcoin Breakout Imminent
Please note: All data, figures & graphs are valid as of October 8th. All trading carries risk. Only risk capital you can afford to lose.
Traditional Markets
Markets were a bit wonky during the New York session yesterday. While the bond markets were closed for the holiday stocks remained open but as stocks have been taking their cues from the bonds lately, there wasn't much to anchor to. Shares in tech stocks performed particularly poorly.
In general, there hasn't been much in the news lately to move the markets too much. The US Dollar remains range bound and we continue to watch the 10-year for any sign of weakness..
Minus Google Plus
Yesterday, Alphabet (NASDAQ:GOOGL) announced that it's scrapping its social network known as Google Plus, due to a hacking incident that exposed about half a million users' personal data.
Though shares did fall on the news, they managed to recover by the end of the day. After all, Google Plus is hardly even used these days and accounts for a negligible portion of the advertising mega-giant's revenues.
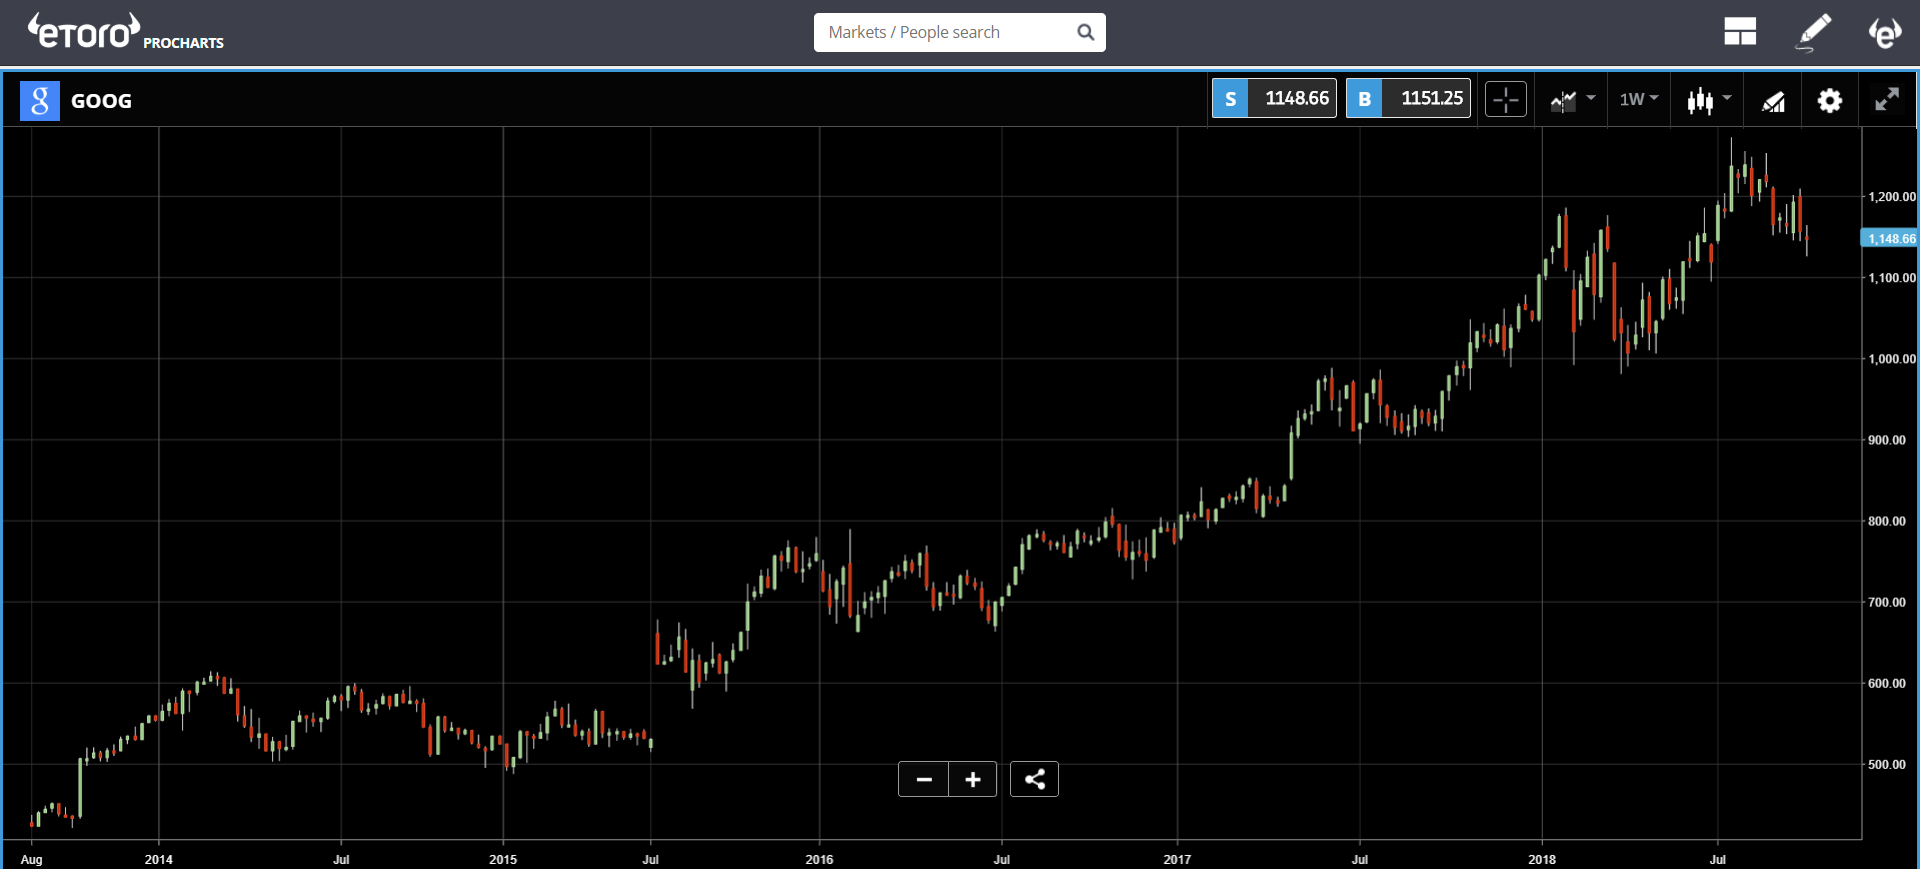
For those of you who are bullish long-term, this might be a good time to get in. For me however, my scepticism in all of the big tech firms has only been reinforced from this story. Much of the value that these shares retain is due to the large amount of personal data they are holding. The more they show that they can't be trusted with this data, the more people will find alternate solutions.
Bitcoin Breakout Chart
As we've been saying, the price of Bitcoin is insanely steady lately and that's a great thing. However, there is a good chance that this will change soon.
This Bitcoin chart shows that over the last year, the range has been getting steadily narrower and has now reached the tip. This is a classic breakout pattern.
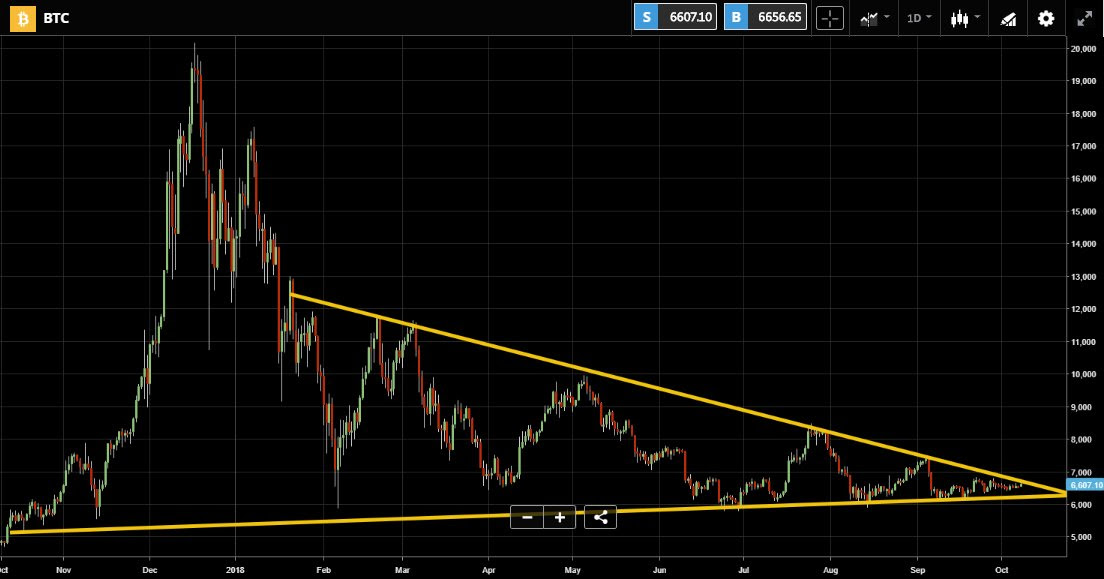
This pattern on the chart is not new to bitcoin. In fact, this is the third time it's come to a head this year.
Here we can see the previous two previous times. Each time we saw a triangle (dotted orange lines) it eventually broke out (purple boxes) to the upside.
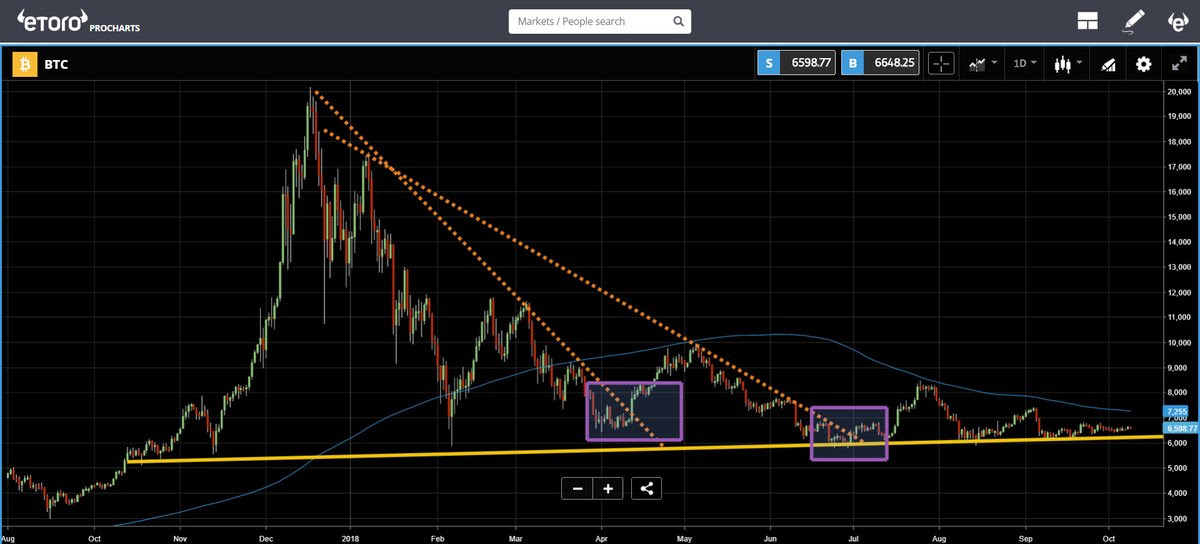
Notice also that in the second chart, I've used the 200-day moving average (blue line) instead of a hand drawn resistance line as above. The reason for this is that hand drawn lines can be different depending on the person who draws them.
In this case, the 200 DMA is a much cleaner indicator of resistance. In fact, we can see that it has bounced off this line about half a dozen times this year.
A strong breakout above the 200 Day Moving Average could easily flip sentiment from bearish to bullish for many cryptotraders.
As always, please let me know if you have any questions, comments, or feedback on this analysis. I'm always happy to hear them.
eToro, Senior Market Analyst
Disclosure: This content is for information and educational purposes only and should not be considered investment advice or an investment recommendation. Past performance is not an indication of future results. All trading carries risk. Only risk capital you're prepared to lose.
