Ripple’s Rally Still Has Room To Run

Published 01/08/2018, 08:10 AM
Updated 07/09/2023, 06:31 AM

Ripple, the only major cryptocurrency that is centralized, briefly became the second largest after Bitcoin, after its price rose from below 20 cents a coin on December 8th, 2017, to over $3.31 by January 4th, 2018. As of this writing, it has been surpassed by Ethereum again, but it still maintains a total market capitalization near $100 billion, making Ripple’s co-founder and executive chairman, Chris Larsen, one of the richest men on the planet, at least on paper.

Good for him. However, what interests us as analysts and traders is where is XRPUSD going next. Are we going to see a new all-time high soon? Are bulls too tired already? The Elliott Wave analysis of Ripple’s 4-hour chart below should give us a hint.
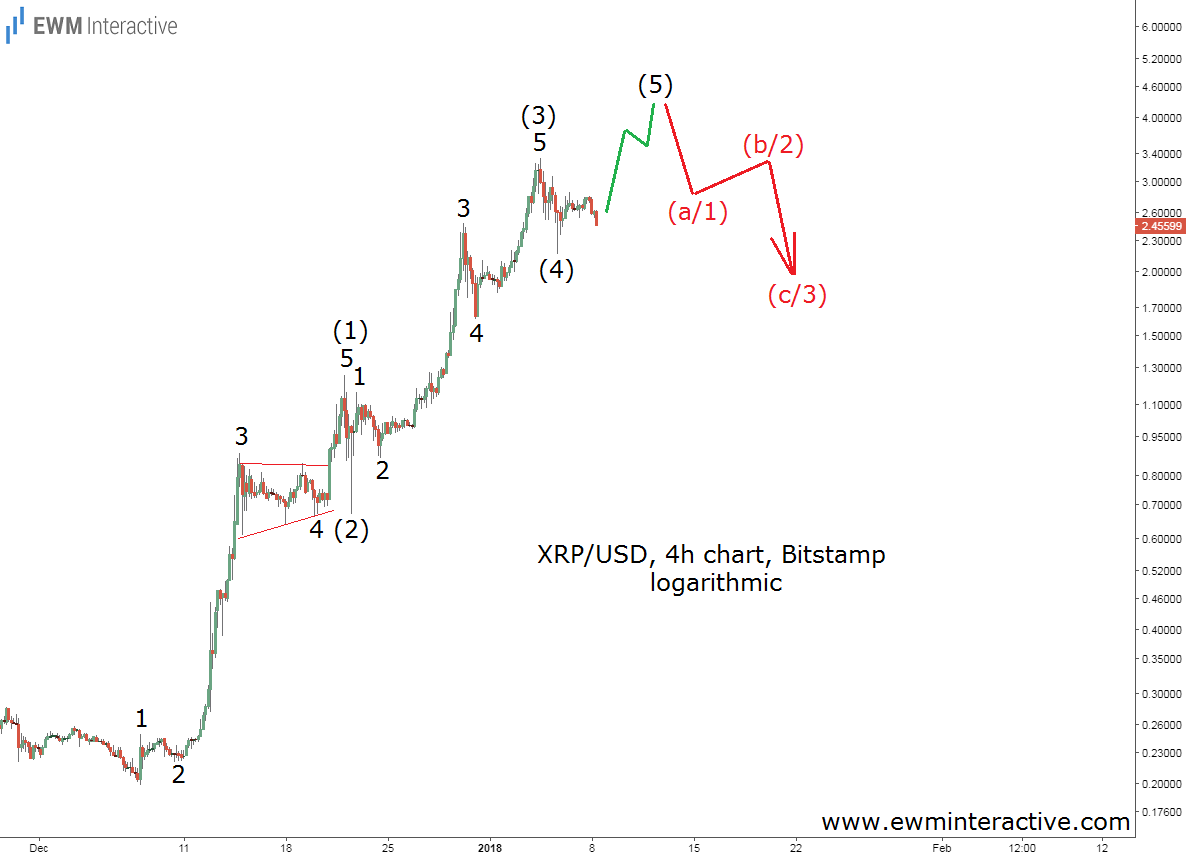
XRP/USD 4H Chart

The logarithmic chart above shows Ripple’s recent ascent from $0.19776 to $3.31700. The San Francisco-based company’s blockchain payment network already serves more than 100 financial institutions, but the price of XRP is still subject to the two basic emotions, which govern the prices of all kinds of assets – fear and greed. Fortunately, these two form repetitive and therefore recognizable patterns.

The price pattern Ripple has been drawing for almost a month looks very similar to a five-wave impulse. Furthermore, the impulsive structure of waves (1) and (3) is also clearly visible. The only problem is that the fifth wave, labeled (5), is still missing, which gives us a reason to expect more strength from now on while it develops.

Wave (5) is supposed to exceed the top of wave (3). On different exchanges, wave (3) climbed to $3.31700, $3.34989 and even $3.84, so it seems reasonable to expect wave (5) to reach the $4 mark. With Ripple currently hovering around $2.49, this means the virtual currency could add another 60% to its market cap.

On the other hand, once the top of wave (3) is taken out, traders should be careful, because according to the Elliott Wave principle, every impulse is followed by a three-wave correction in the opposite direction.

Original post

Latest comments

Loading next article…
Risk Disclosure: Trading in financial instruments and/or cryptocurrencies involves high risks including the risk of losing some, or all, of your investment amount, and may not be suitable for all investors. Prices of cryptocurrencies are extremely volatile and may be affected by external factors such as financial, regulatory or political events. Trading on margin increases the financial risks.
Before deciding to trade in financial instrument or cryptocurrencies you should be fully informed of the risks and costs associated with trading the financial markets, carefully consider your investment objectives, level of experience, and risk appetite, and seek professional advice where needed.
Fusion Media would like to remind you that the data contained in this website is not necessarily real-time nor accurate. The data and prices on the website are not necessarily provided by any market or exchange, but may be provided by market makers, and so prices may not be accurate and may differ from the actual price at any given market, meaning prices are indicative and not appropriate for trading purposes. Fusion Media and any provider of the data contained in this website will not accept liability for any loss or damage as a result of your trading, or your reliance on the information contained within this website.
It is prohibited to use, store, reproduce, display, modify, transmit or distribute the data contained in this website without the explicit prior written permission of Fusion Media and/or the data provider. All intellectual property rights are reserved by the providers and/or the exchange providing the data contained in this website.
Fusion Media may be compensated by the advertisers that appear on the website, based on your interaction with the advertisements or advertisers.
© 2007-2025 - Fusion Media Limited. All Rights Reserved.