The cryptocurrency crash of the first three months of 2018 did not spare anyone. Most virtual currencies lost between 60% and 80% of their market capitalization and Ripple, which was briefly the second largest after Bitcoin, plunged as well. Between January 4th and April 1st, XRP/USD fell from its all-time high of $3.3170 to as low as $0.4535, losing as much as 86% of its value.
And just when crypto investors were ready to throw in the towel the price of Ripple made a U-turn and after a recovery to $0.9649 by April 24th, is currently hovering around the $0.80 mark. Should traders expect this rally to continue? Are the bulls still strong enough to lift the pair above the $1 mark again? The Elliott Wave analysis below looks encouraging.
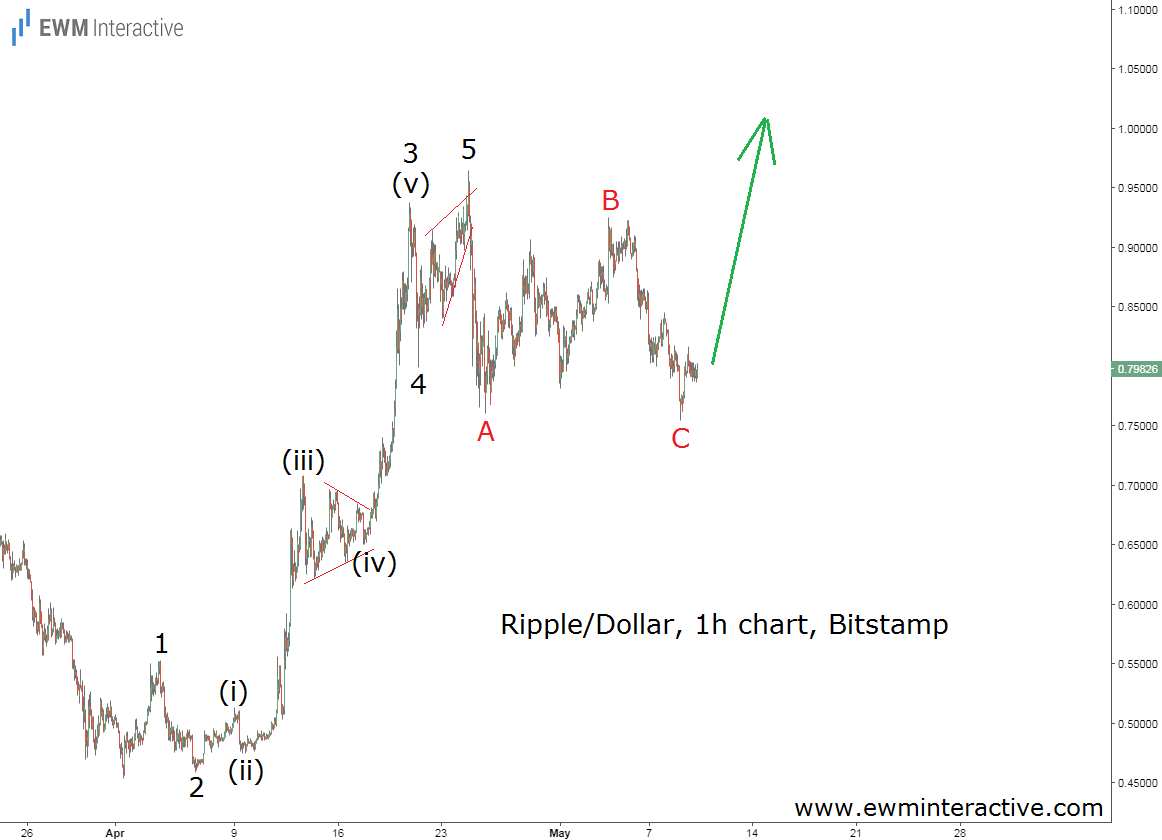
The hourly chart of Ripple against the U.S. dollar shows that the wave structure of the surge between $0.4535 and $0.9649 is impulsive. It can easily be labeled as 1-2-3-4-5. In addition, wave 3 is extended, which allows us to label its sub-waves, as well. Wave (iv) of 3 is a triangle, while wave 5 is an ending diagonal. If that is correct, the following pullback to $0.7545 on May 9th is a natural three-wave correction in the form of a simple A-B-C zigzag.
It looks like the hourly chart of Ripple depicts a textbook 5-3 wave cycle to the north. According to the theory, the trend should now be expected to resume in the direction of the five-wave pattern, which means XRPUSD is finally ready to conquer $1 again. Even if the bears manage to drag the price below the last swing low of $0.7545, this bullish count will remain valid as long as the starting point of the impulsive sequence at $0.4535 holds. At least in the short-term, there is still hope for Ripple bulls.
