
Two of my favorite bloggers, who hail from very different corners of the investment landscape, both happened to mention me in reference to the VIX:VXV ratio in the past few days.
On Wednesday, in A Buy Signal from the Option Market, Cam Hui of Humble Student of the Markets, noted that the VIX:VXV ratio had fallen below 0.92, where “it has provided reasonably good long entry points in the past.” Cam linked back to my first post on the VIX:VXV ratio from December 2007, which, I am fairly certain is the first time anyone ever mentioned the ratio and suggested that it might have some value as a market timing signal.
Friday Russell Rhoads of the CBOE, whose Trading VIX Derivatives: Trading and Hedging Strategies Using VIX Futures, Options, and Exchange Traded Notes is undoubtedly the best book ever published on the VIX, also mentioned the VXV:VIX ratio in one of his weekly volatility columns, This Week in VIX Options and ETPs – 9/13/2013. Russell’s version of this ratio, VXV:VIX, flips the numerator and denominator, so his comments are the inverse of much of my analysis. “Note on the chart there are a few instances where the ratio of VXV to VIX falls below 1.0. That seems to coincide with a subsequent near term bottom in the stock market as well.”
I have literally dozens of posts on the VIX:VXV ratio going back to 2007 and while I have hand-picked a selection of posts below that focus on this subject, I could easily fill a book with data, interpretative overlays and trading strategy ideas based on VXV (essentially a 93-day version of the VIX) and its relation to VIX and other measures of volatility.
One of the more interesting issues related to the VIX:VXV ratio is how that ratio has moved up and down over the course of various volatility regimes. In the first two years of the ratio (2007 and 2008), the average (mean) ratio was 0.97 and 1.02; during the past two years, however, the average (mean) ratio has fallen all the way down to 0.87 and 0.90.
For about 1 ½ years following the launch of VXV, using absolute levels in the VIX:VXV ratio as bullish and bearish signals worked almost perfectly. One only has to look at VIX:VXV Ratio Moving Toward Bearish Zone to understand why it quickly gained so many fans. When the 2008 financial crisis hit and in the aftermath of the crisis, the VIX:VXV ratio began to look like just another broken indicator. Since that time, the VIX:VXV ratio has continued to be a very useful indicator, yet its value has been greater when studied in relative terms than absolute terms. Old rules, such as increasing long equity exposure when VIX:VXV fell to 0.92 or 0.90, proved to be of little help when the average of the ratio hovered around 0.90 instead of 1.00.
During the last two years, the VIX futures term structure has departed significantly from historical norms, as I have demonstrated in the likes of The 2012 VIX Futures Term Structure as an Outlier. Frankly, the 2013 version of the VIX futures term structure looks a lot more like the outlier 2012 data set than any previous year.
There are many ways to think about a ratio in relative terms. Using percentiles, standard deviations and short-term vs. long-term moving averages are just some of the ways that one can rethink the VIX:VXV ratio in relative terms. In the chart below, for instance, I have calculated the two-week moving average of the VIX:VXV ratio relative to the moving average for the past quarter. This keeps the data standardized around a mean of 1.00 and allows for a way to evaluate the ratio on a relative basis, regardless of whether the current volatility regime has depressed or lifted the ratio data for the full lookback period. Note how extremes in this ratio of ratios has been an effective market timing signal over the course of the past eleven years.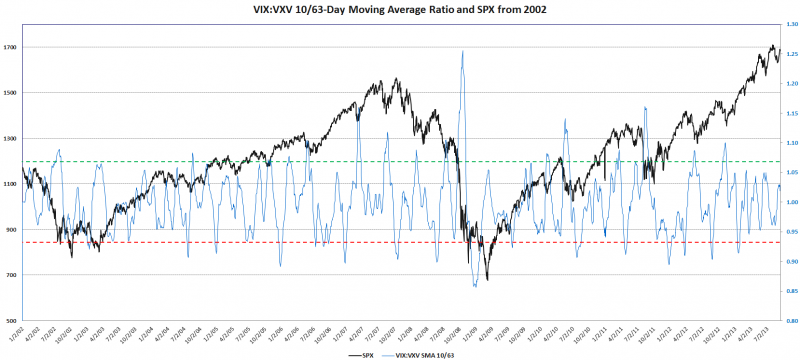
Given the scope of the issues that are related to VXV and the VIX:VXV ratio, I pledge to devote a good deal more space to these issues going forward, including the twists and turns in the VIX futures term structure, the use of the VIX:VXV ratio in determining the dynamic allocations for XVZ, etc.
For those who are doing some of their own research into these and some tangential subjects, the links below are an excellent point of departure.
- English (UK)
- English (India)
- English (Canada)
- English (Australia)
- English (South Africa)
- English (Philippines)
- English (Nigeria)
- Deutsch
- Español (España)
- Español (México)
- Français
- Italiano
- Nederlands
- Português (Portugal)
- Polski
- Português (Brasil)
- Русский
- Türkçe
- العربية
- Ελληνικά
- Svenska
- Suomi
- עברית
- 日本語
- 한국어
- 简体中文
- 繁體中文
- Bahasa Indonesia
- Bahasa Melayu
- ไทย
- Tiếng Việt
- हिंदी
Revisiting The VIX:VXV Ratio
Latest comments
Loading next article…
Install Our App
Risk Disclosure: Trading in financial instruments and/or cryptocurrencies involves high risks including the risk of losing some, or all, of your investment amount, and may not be suitable for all investors. Prices of cryptocurrencies are extremely volatile and may be affected by external factors such as financial, regulatory or political events. Trading on margin increases the financial risks.
Before deciding to trade in financial instrument or cryptocurrencies you should be fully informed of the risks and costs associated with trading the financial markets, carefully consider your investment objectives, level of experience, and risk appetite, and seek professional advice where needed.
Fusion Media would like to remind you that the data contained in this website is not necessarily real-time nor accurate. The data and prices on the website are not necessarily provided by any market or exchange, but may be provided by market makers, and so prices may not be accurate and may differ from the actual price at any given market, meaning prices are indicative and not appropriate for trading purposes. Fusion Media and any provider of the data contained in this website will not accept liability for any loss or damage as a result of your trading, or your reliance on the information contained within this website.
It is prohibited to use, store, reproduce, display, modify, transmit or distribute the data contained in this website without the explicit prior written permission of Fusion Media and/or the data provider. All intellectual property rights are reserved by the providers and/or the exchange providing the data contained in this website.
Fusion Media may be compensated by the advertisers that appear on the website, based on your interaction with the advertisements or advertisers.
© 2007-2025 - Fusion Media Limited. All Rights Reserved.