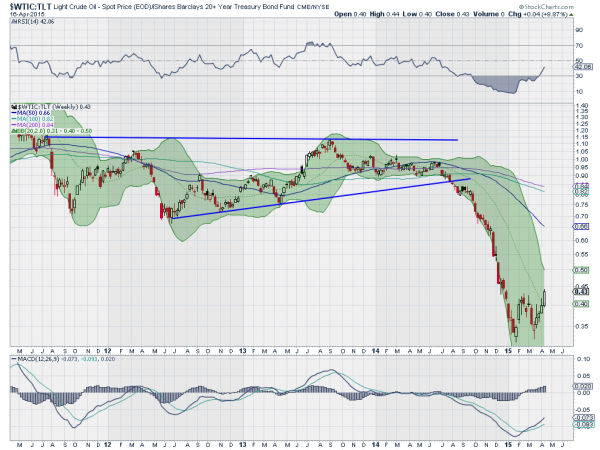
Six weeks ago I took a look at the ratio of crude oil to US Treasury Bonds in this post. There was a 6-year double bottom forming at the time although it was early in the process. Since that time the ratio has moved around a bit but is confirming that bottom and reversal.

The chart above shows the ratio of West Texas Intermediate Crude (NYSE:USO) to the Treasury Bond ETF (ARCA:TLT). It is a weekly chart so a bit more detail than the last look. And what it shows is the strong move lower bottoming just past the target at 0.40 for the fall out of the ascending triangle. What is more, is there is a classic shorter term bottoming pattern in the ‘W’ that has played out in 2015 so far. This week sees a push over the middle of the ‘W’ and over the 20 week SMA.
A continuation next week would trigger a trade of long crude oil and short Treasuries, looking for a retracement higher. The momentum indicators shown support this idea. The RSI is rising off of a bottom and the MACD is building higher as well. The 50-week SMA at a ratio of about 0.66 near the bottom of the triangle is a good target as there is not much history in between.
The information in this blog post represents my own opinions and does not contain a recommendation for any particular security or investment. I or my affiliates may hold positions or other interests in securities mentioned in the Blog, please see my Disclaimer page for my full disclaimer.
