The cycle of accumulation and distribution defines mark down for wheat.
Heavy rains across the southern and central U.S. Plains throughout May boosted wheat production, the U.S. Agriculture Department reported on June 10. The harvest forecast which exceeded expectations sent wheat prices lower on Wednesday. Wheat (WEAT), mired in a down trend since 2011, remains weak despite an aging bull phase. The transition from a bull to bear phase in the coming months would support further price declines.
Insights follows interplay of price, leverage, time, and sentiment (click for further discussion of Reviews) to help recognize a transition from mark down to cause for subscribers.
Please join us.
Trend
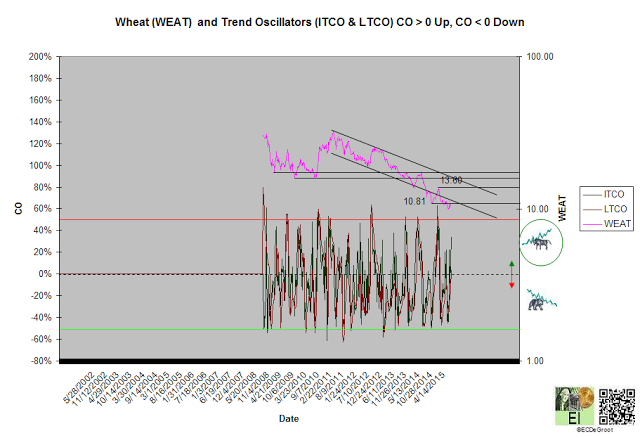
Positive trend oscillators define up impulse and fresh rally 10.97 since the second week of June (chart 1). The bulls control the trend until this impulse is reversed.
A sustained close above 10.81 jumps the creek and transitions the cycle from mark down to cause.
Leverage
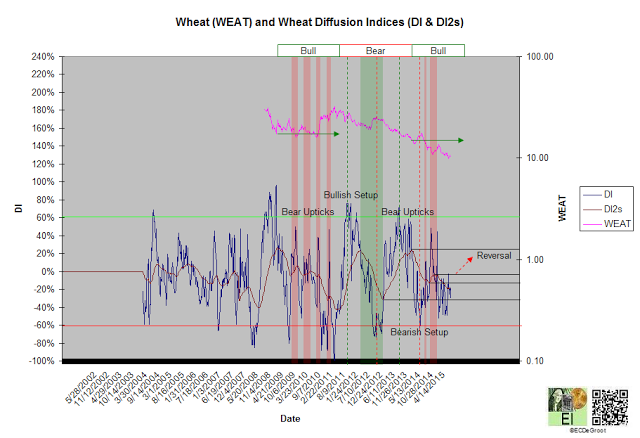
The flow of leverage defines bull phase since December 2013 (chart 2). A DI2 close above its December 2013 high reverses the phase.
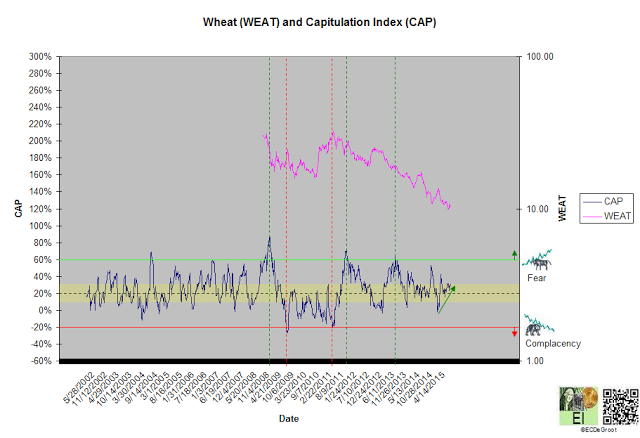
A diffusion index (DI) of -30% maintains the bearish bias. A capitulation index (CAP) of 32%, an indication of growing fear (bullish), supports a bullish bias (chart 2A). Mild disagreement between DI and CAP supports the countertrend rally over the short-term. This tightens risk management for bears that shorted the bearish crossover in January.
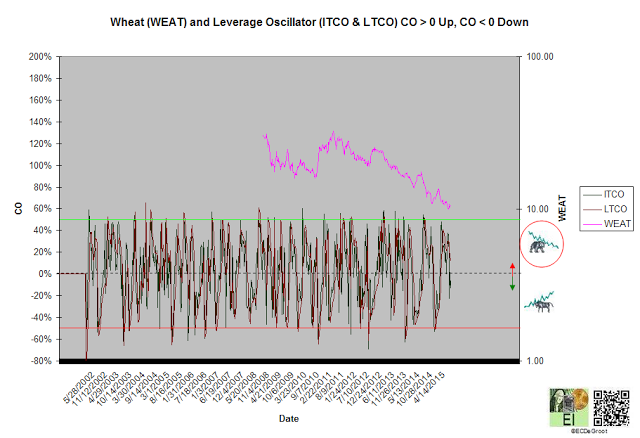
Positive leverage oscillators define an up impulse that opposes the bull phase but supports the bear trend (chart 3).
Time/Cycle
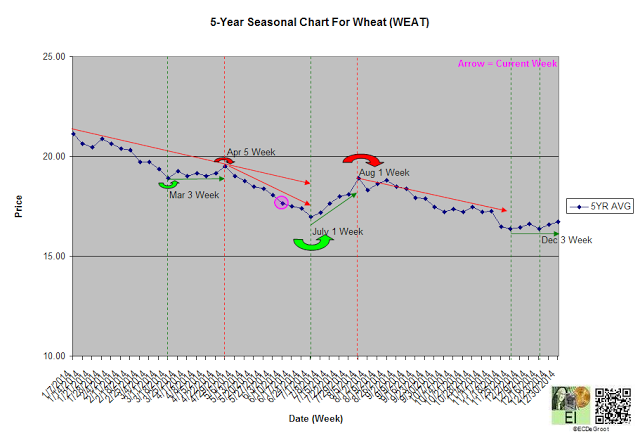
The 5-year seasonal cycle defines weakness until the first week of July or summer transition (chart 4). This trend advises caution for the bulls.

