A 25 basis point (bp) interest rate cut, the third reduction in six months that follows 100 bp reduction in the reserve requirement a month ago, and the Fed's reluctance to hike rates extends a coordinated effort to spur economic growth throughout the global economy.
While coordinated 'stimulus' supports a countertrend rally of commodities foreshadowed by negative concentration discussed months ago, it won't reverse defensive global capital flows regardless of the hype. Defensive flows likely includes US Treasury bonds until the wolf pack culls the herd of weak European and Asian debt. Only after they're thinned will the focus turn to the US. Gentleman could very well prefer government bonds, notes, and bills at least in the initial stages of the next panic.
What Mellow omitted is that investors prefer the public sector (bonds) when confidence in the private sector (stocks) is failing. Investors preferred bonds in 1929 because confidence in the private sector was failing. While gentlemen could prefer bonds in the initial stages of the next panic, they'll like turn on them as confidence in the public sector falters from an already shaken position. This will burn a majority populated by central bankers and followers of today's bullish headline hype rather quickly.
Investors, largely driven by emotions rather than discipline, tend to focus on volatility rather than the message of the market. This tendency prevents them from recognizing better opportunities in quieter markets.
Summary
The BULL (Price) and BULL (Leverage) trends under Q3 distribution after the seasonal high position US Treasury bonds (TLT) as a focused bull opportunity since the first week of January 2016.
Price
Interactive Chart: NYSE:TLT, TLT PF
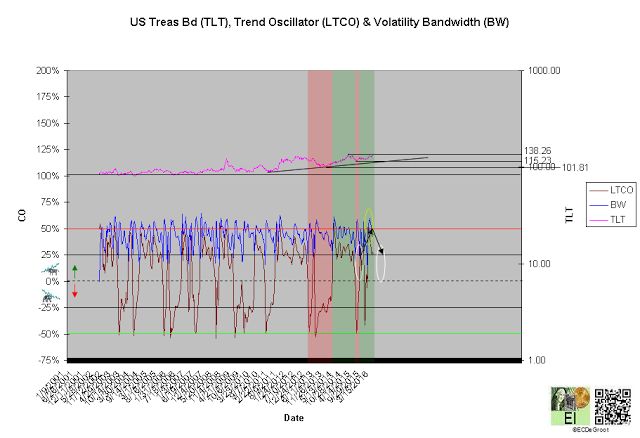
The long-term trend oscillator (LTCO) defines up impulse and annualized return of 15% from 123.36 to 128.36 since the first week of January (chart 1). The bulls control the trend until reversed by a bearish crossover. Compression, the final phase of the CEC cycle, generally anticipates this change.
A close above 138.26 jumps the creek and transitions the trend from cause to mark up, while a close below 115.23 breaks the ice and transitions it to mark down.
Chart 1
Leverage
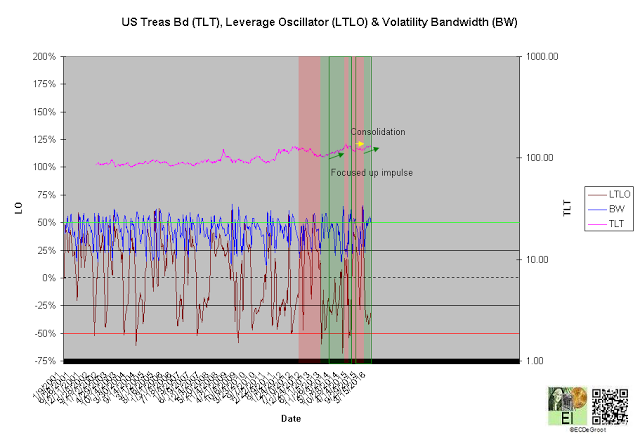
A negative long-term leverage oscillator (LTLO) defines a bull phase since the fifth week of December 2015 (chart 2). This focuses the up impulse (see price).
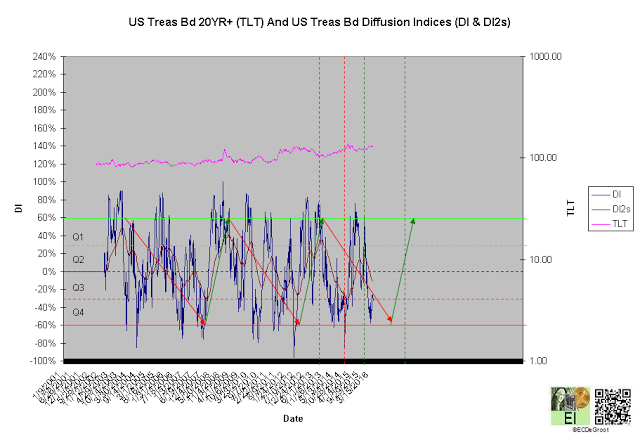
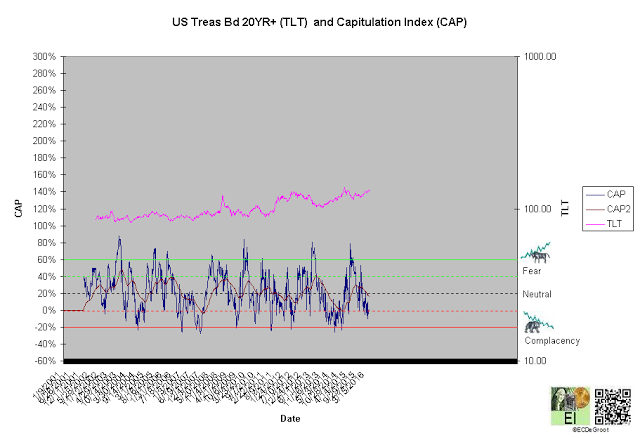
A diffusion index (DI) of -33% defines Q3 distribution (chart 3). A capitulation index (CAP) of 0% confirms this message (chart 4). DI and CAP's trends, broader flows of leverage and sentiment from accumulation to distribution and fear to complacency supporting the bulls (red arrows), should not only continue to extreme concentrations but also restrain downside expectations until reversed (see price). A decline under these trends, a sign of weakness (SOW), would be bearish for Treasuries longer-term.
The majority's confidence the existing, dollar-centric financial system from its leadership to policies, remains steady as long as US Treasury, German bunds, and other key public sector assets rally under episodes of fear - the risk-aversion trade. Going forward, the perception that public sector assets are safe havens will fade as investor recognize that its the source of the financial and economic problems. The majority, a day late and dollar short in terms of timing, will panic into US stocks, corporate bonds, gold, and other private sector assets only after economic reality completely invalidates their beliefs.
Chart 2
Chart 3
Chart 4
Time/Cycle
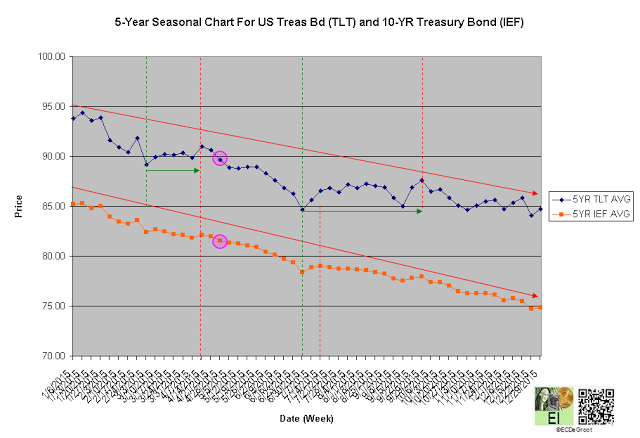
The 5-year seasonal cycle defines strength until the second week of April (chart 5). This path of least resistance restrains downside expectations (see price).
Chart 5

