The cycle of accumulation and distribution defines counter-trend decline within cause (building)/distribution for the US Dollar Index (UUP).
The US Dollar Index or Dixie for short, an index or basket of trade weighted currencies, has been building cause since March 2015. Cause, a transfer of leverage and sentiment from weak (majority) to strong hands (minority), will transition the trend to mark up once enough 'energy' is accumulated to jump the creek resistance. Traders timing the Dixie's transition, therefore, should be following the Dollar Index and Major Currency's Diffusion Index.
The US Dollar Index has been sending a message of caution since November 2014. Extreme DI readings below -80% not only advised tighter risk management for bulls through February 2015, but also foreshadowed the onset of cause (building) in March 2015. As long as the Dixie remains in cause, plenty of bears will be yelling TOP! Bearish headlines, many stoking the fire of fear, will turn the majority bearish over time. This conversion, the accumulation of the energy necessary to jump the creek of cause and transfer of ownership in which the minority fades the extreme pessimism of the majority, continues today.
Trend
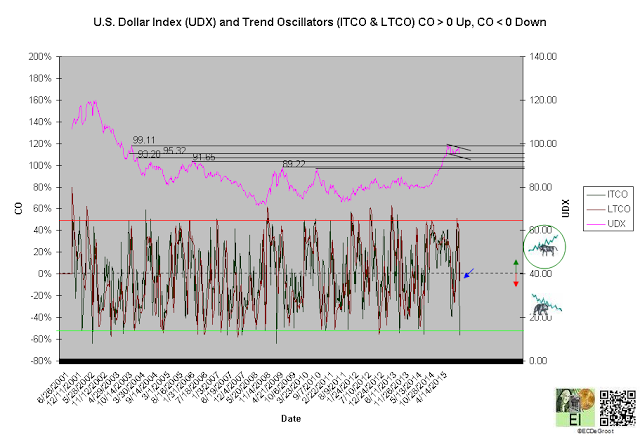
Negative trend oscillators define a bearish crossover and the onset of down impulse (decline) during the fourth week of August (chart 1). The bears control the trend until this impulse is reversed.
A sustained close above 99.11 jumps the creek confirms continuation of the mark up. A close below 93.28 extends the countertrend decline.
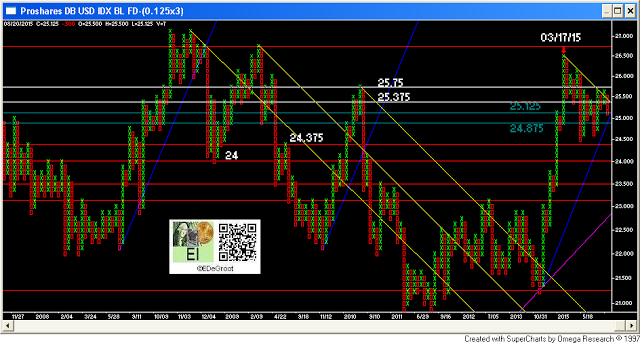
The US Dollar Index ETF (UUP) defines not only important support and resistance but also pinpoints the onset of cause building in March (chart 1A). A close above 25.625 generates a rising trend or bullish bias within cause. A close above 26.5, an inevitable outcome driven by the transition of the business cycle from prosperity to liquidation — a feeble economic expansion to decisive contraction, convert's the Dollar Index's trend from cause (building) to mark up.
Chart 1
Chart 1A
Leverage
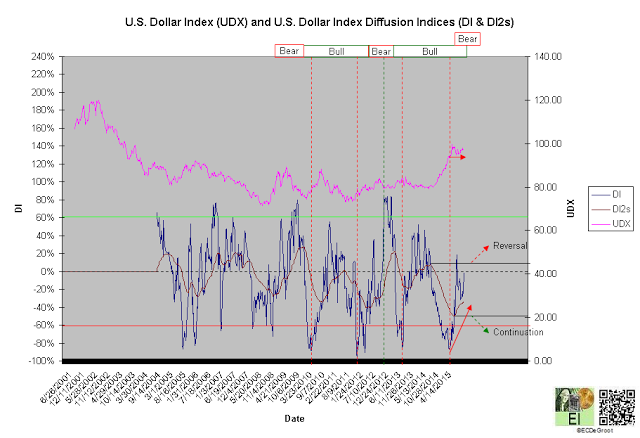
The flow of leverage defines bull phase since March 2013 (chart 2). A DI2 close above its April 2014 high not only reverses the phase but also shortens today's bull phase. A DI2 close below its April low confirms continuation.
The November to March bearish setup/cluster, the setup that increased the probability of cause and advised tighter risk management for bulls, continues to unwind; this is defined by a rising DI during cause. Traders, employing the reverse logic of risk management used mark up, reduce risk as DI rises within cause.
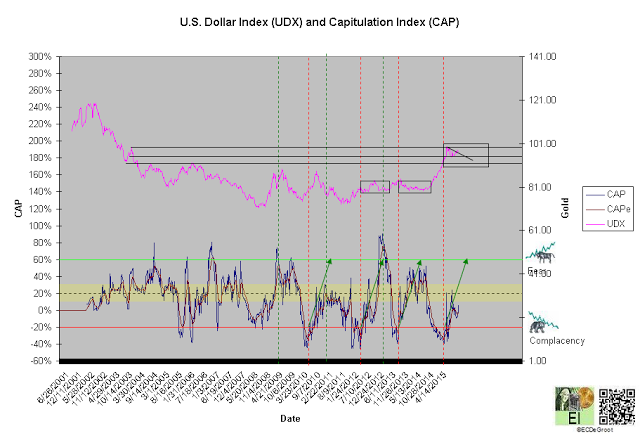
A diffusion index (DI) of -1%, the highest reading since early May, defines a neutral market and maintains the trend of steady yet volatile accumulation since February. A capitulation index (CAP) of 6% supports this message (chart 2A). These trends, the flow of leverage and sentiment from distribution to accumulation and complacency to fear, support not only continuation of cause (building) but also tighter risk management for the bulls.
Position traders are tracking the Major Currencies DI (MCDI) not only for confirmation by also long-term buy and sell signals (chart 2A). MCDI, an indicator available to subscribers only, supports and defines cause building since January 2015.
The US dollar (US Dollar Index) will likely remain in cause (building) until DI and CAP, both directed by price and time, define concentrated accumulation (DI) and fear (CAP). The majority, notorious market timers, will turn bearish as price and DI decline and rise, respectively. This transfer is sending DI and CAP towards (and likely to) extreme concentration.
Chart 2
Chart 2A
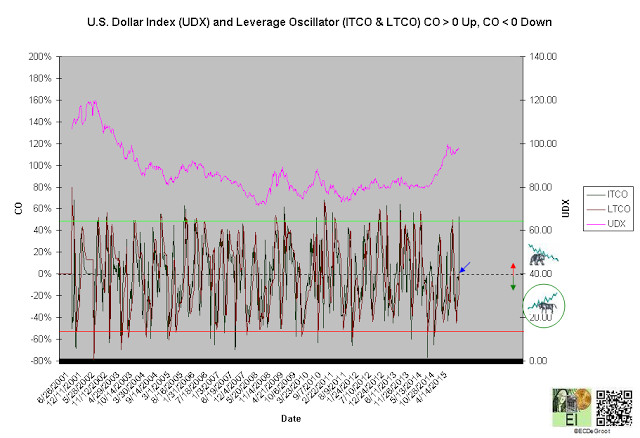
Positive leverage oscillators define a bullish crossover and a up impulse that opposes the bull phase and supports the bear trend (chart 3).
Chart 3
Time/Cycle
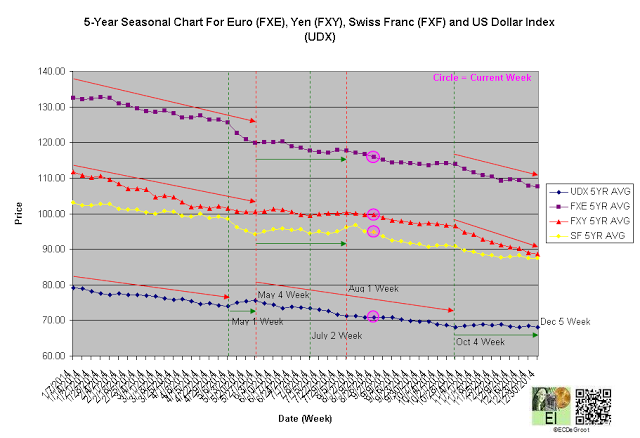
The 5-year seasonal cycle defines weakness until the fourth week October (chart 4). Strong safe haven capital flow, those fleeing growing uncertainty in Europe and Asia, has maintained a 'floor' under dollar since 2014. This should maintain the upward bias within cause and eventually resume mark up despite seasonal tendencies.

