The cycle of accumulation and distribution defines cause (building) within a broader mark up phase for US 10-year bond.
A series of interest rates cuts and a reduction in reserve requirements by China and numerous 'competitive' currency devaluations, suggest not only a quiet panic behind the velvet ropes of leadership but also a coordinated effort to reignite growth within an increasing stagnant global economy.
While coordinated 'stimulus' supports a countertrend rally of commodities foreshadowed by negative concentration discussed months ago, it won't reverse defensive global capital flows regardless of the hype. Defensive money flows likely include US Treasury bonds and US 10-year bonds until the wolf pack culls the herd of weak European and Asian debt. The pack will thin the herd from the periphery (emerging markets, Asia, and Europe) toward the core (United States) economy. Government bonds, the previous cycle's safe haven, could transition to mark up as the global economy turns down and world panics; gentleman could prefer government bonds, notes, and bills at least in the initial stages of the next panic.
Complacency toward longer duration bonds, however, should turn to fear. What Mellow omitted is that investors prefer the public sector (bonds) when confidence in the private sector (stocks) is failing. Investors preferred bonds in 1929 because confidence in the private sector was failing. While gentlemen should prefer bonds once again, they'll likely turn on them with a prejudice not seen in generations as confidence in the public sector and leadership behind the curtain falters. This will turn complacency into fear rather quickly.
Insights follows interplay of price, leverage, time, and sentiment (click for further discussion of Reviews) to help recognize the transition from cause (building) to mark up or mark down for subscribers.
Trend
Positive trend oscillators define an up impulse (rally) from 106.05 to 107.24 since the first week of August (chart 1). The bulls control the trend until this impulse is reversed.
A close above 108.83-109.81 jumps the creek and transitions the trend from cause to mark up. This outcome is possible during the early stages of the next panic. A close below 104.54 maintains the bearish bias within cause. A close below 98.94-99.24 breaks the ice and transitions the trend from cause to mark down.
An overbought (OB) trend increases the probability of profit-taking at least over the short-term.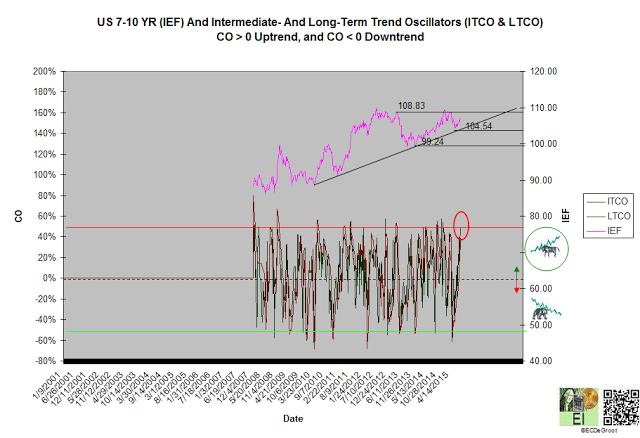
Leverage
The flow of leverage has defined bear phase - generally positive flow (upward drift) of leverage since November 2010 (chart 2). A DI2 close below its October 2012 low reverses the phase. A DI2 close above its January 2015 high confirms continuation.
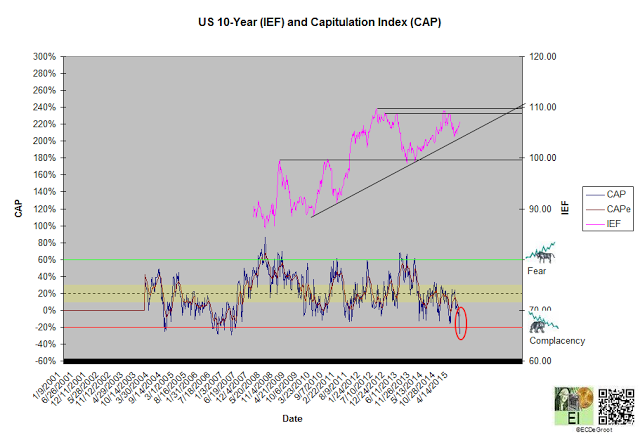
A diffusion index (DI) of -63% defines a bearish setup and concentrated distribution. A capitulation index (CAP) of -28%, an indication of extreme complacency, supports DI's bearish message (chart 2A). These trends, the flow of leverage and sentiment from accumulation to distribution and fear to complacency - transfers that define an ongoing reallocation from risk-on (stocks) to risk-off assets (bonds and cash) into the fall transition (see time) support the bulls. Last week's bearish setup and extreme complacency, however, immediately tighten their risk management. The old saying, bulls make money, bears make money, but pigs - those that fail to protect profits when probabilities turn against them get slaughtered.
A temporary reallocation from risk-on to risk-off assets, the buying of US 10-year bonds, could be part of a failed decline that converts the majority from bullish to bearish on US stocks. A failed decline would most likely complete the oscillation from optimism to pessimism that began in November 2014 and generate a major buying opportunity for US stocks.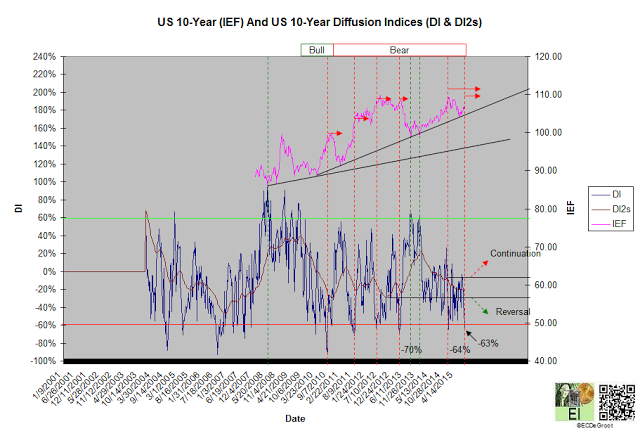
Negative leverage oscillators define a bullish crossover and down impulse that opposes the bear phase and supports the bull trend.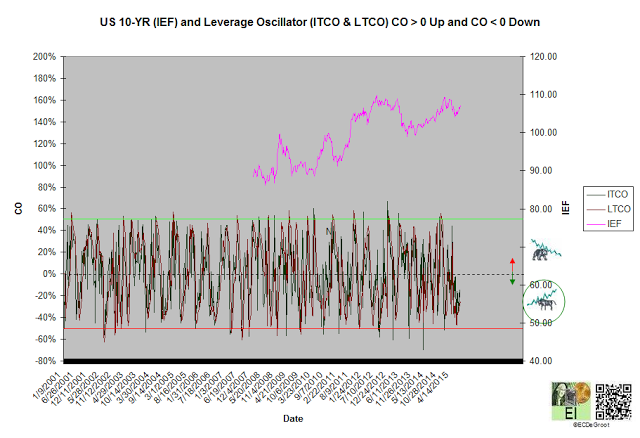
Time/Cycle
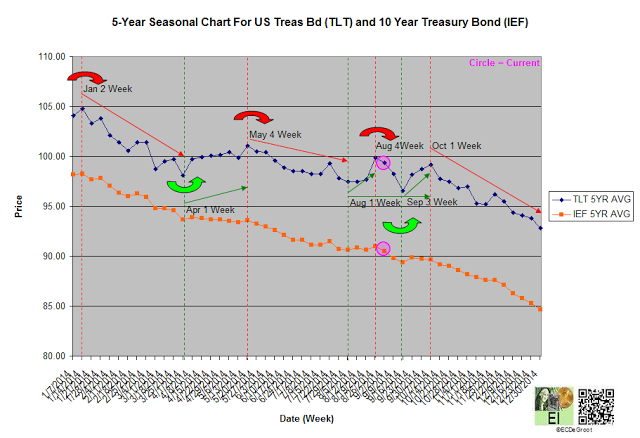
The 5-year seasonal cycle defines strength and bullish sideways chop until the the fourth week of August and first week October, respectively (chart 4). This transition advises tighter risk management for the bulls as time passes. 2015's summer transition could be amplified by the euro zone crisis, an evolving crisis hindered by a general unwillingness to concede power and underlying trends from cooperation to separation throughout Europe.