The cycle of accumulation and distribution defines cause for soybeans.
America's farmers are harvesting huge amounts of corn and soybeans, according to the U.S. Department of Agriculture (USDA). The numbers, if realized, are expected to reach 13.6 and 3.89 billion bushels of corn and soybeans. These impressive numbers, the third and second largest crops on record according to the USDA, represent huge supply injection into markets struggling to simply maintain cause building since 2008.
Building distribution (falling DI and CAP trends) as price consolidates within a downtrend reflects the anticipation of lower corn and soybeans prices after the near-record harvests. America's farmers should be prepared for this outcome.
Price
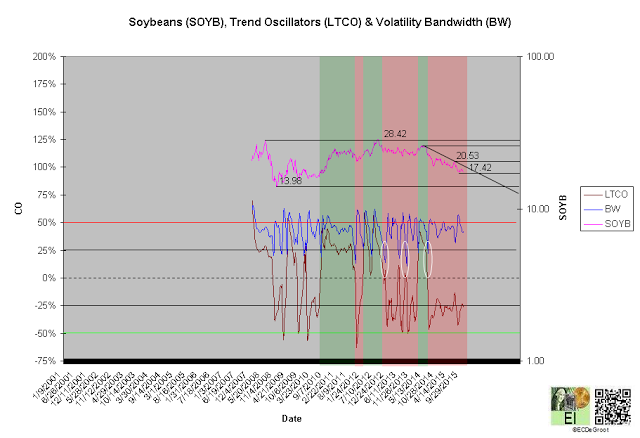
A negative long-term trend oscillator (LTCO) defines a down impulse from 22.52 to 17.25 since the second week of July 2014 (chart 1). The bears control the trend until reversed by a bullish crossover. Compression (white circles) generally anticipates this change.
A close above 20.53 jumps the creek and transitions the trend from cause to mark up. Last week's close below 17.42 maintains the decline within cause. A close below 13.98 breaks the ice and transitions the trend from cause to mark down.
Chart 1
Leverage
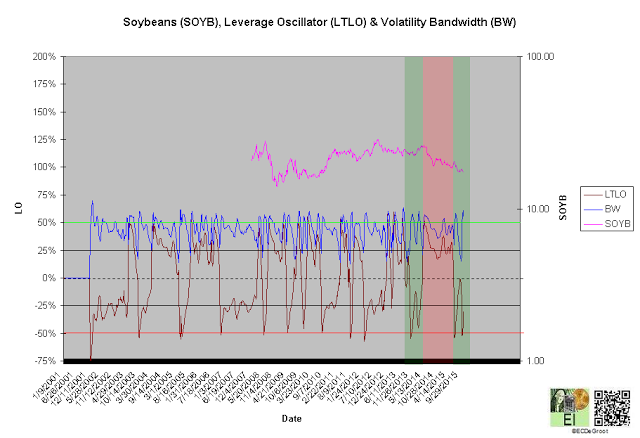
A negative long-term leverage oscillator (LTLO) defines a down impulse and bull phase since the fifth week of June (chart 2). The bull phase, a conflicting message from the leadership of leverage and price, tightens risk management for the bears (see price).
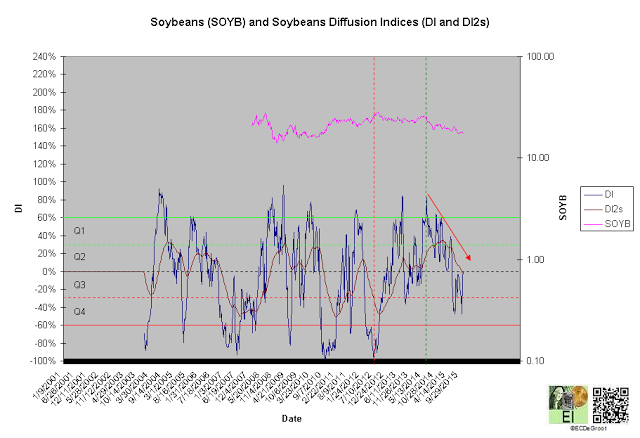
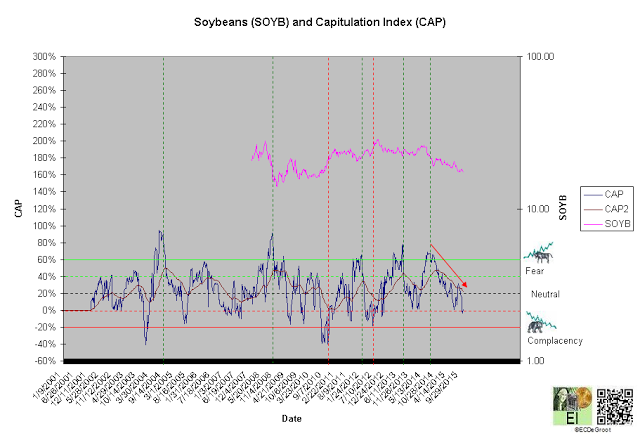
A diffusion index (DI) of 0% defines growing Q3 distribution (chart 3). A capitulation index (CAP) of 1% supports this message (chart 4). DI and CAP's trends, broader flows of leverage and sentiment from extreme accumulation (green dotted line) to distribution and extreme fear (green dotted line) to complacency supporting the bulls (red arrows), should not only continue to extreme concentrations but also restrain downside expectations until reversed (see price).
Continuation of the decline within these trends represents a SOW. This is bearish for beans longer-term.
Chart 2
Chart 3
Chart 4
Time/Cycle
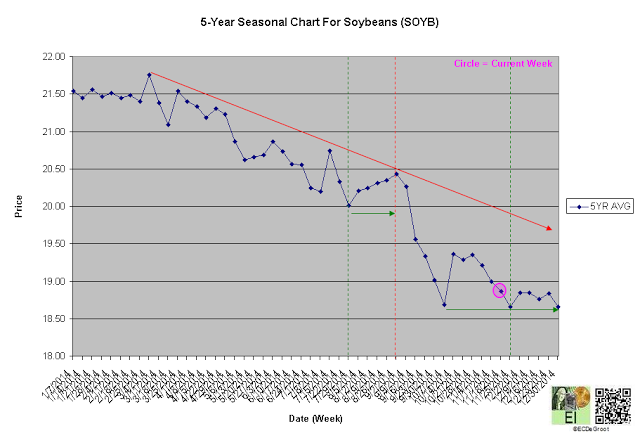
The 5-year seasonal cycle defines weakness until the end of the year (chart 5). This path of least resistance restrains upside expectations (see price).
Chart 5

