Palladium remains in cause within broader mark down phase.
Insights will be following interplay of price, leverage, and time closely to help recognize when cause, the accumulation of energy that fuels the next impulse within mark up or mark down for subscribers.
Please join us.
Understanding Reviews provides a detailed discussion of how to use and understand market reviews.
Trend
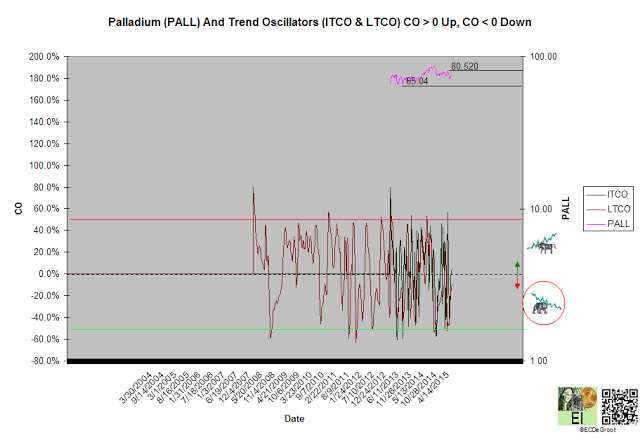
Negative trend oscillators define a down impulse and sideways chop from 75.45 to 75.21 since the third week of January (chart 1). The bears control the trend until this impulse is reversed.
A sustained close above 80.52 jumps the creek and extends the rally. A close below 65.04 confirms continuation of mark down.
Leverage
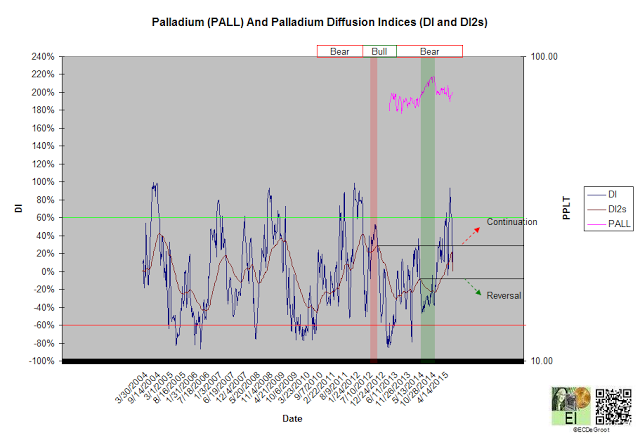
The flow of leverage defines a bear phase or positive flow of leverage since April 2013 (chart 2). A DI2 close below its February 2014 low reverses the phase (green arrow). A DI2 close below its August 2012 high confirms continuation (red arrow).
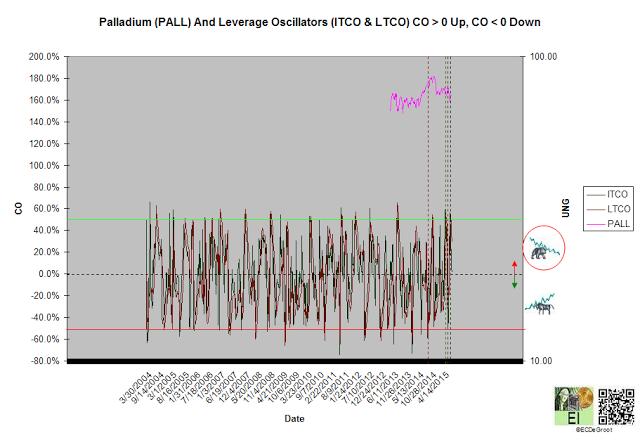
Positive leverage oscillators define an up impulse that supports the bear phase and trend (chart 3). The first week of April's oversold (OS) marked a trading low. OS are marked by dark green dotted lines. Further declines are unlikely until OS cycles or 'unwinds' to overbought (OB). OB are marked by dark red dotted lines.
The bulls, in other words, temporarily have the upper hand while the bears control the trend (see trend). This dynamic, the ebb and flow within trends, exists in all markets. Experienced traders learn to recognize it.
Time/Cycle
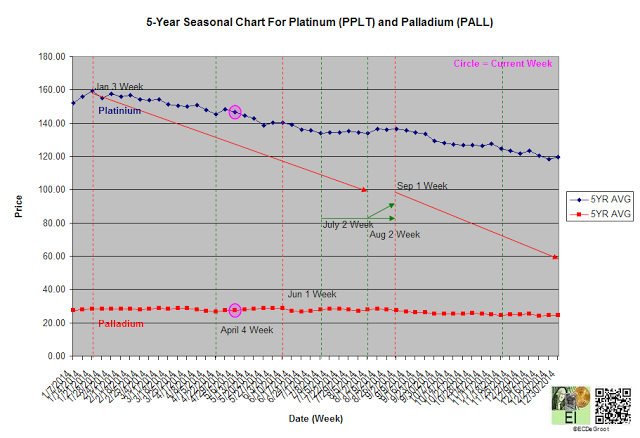
The 5-year seasonal cycle defines an slight upward drift until the first week of June (chart 4). After that, the seasonal cycle defines a general downtrend until the winter transition. Time, the driver of price and leverage, advises short-term caution for the bears.


