Cheap banks loans, falling oil prices and economic growth have supported a rising trend in automobile sales since 2009. This trend has been boosting demand for raw commodities used in the production of cars from aluminum for body sheets, rubber for tires, steel for chassis, to palladium for catalytic converters. While a fair number of experts remain bullish on palladium, they likely do not recognize economic deterioration throughout the global economy and a probable transition within the business cycle from prosperity to liquidation by 2016. This transition would be bearish for automobile sales and commodities used in their production.
Investors, largely driven by emotions rather than discipline, tend to focus on volatility rather than the message of the market. This tendency prevents them from recognizing better opportunities in quieter markets such as Palladium.
Insights constructs and interprets the message of the market, the flow of sentiment, price, leverage, and time in order to define trends within the cycle of accumulation and distribution for subscribers.
Summary
The BEAR (Price) and BEAR (Leverage) trends under Q1 accumulation after a seasonal high position palladium as a focused bear opportunity since the second week of November 2015.
Price
Interactive Charts: PALL, $PALL
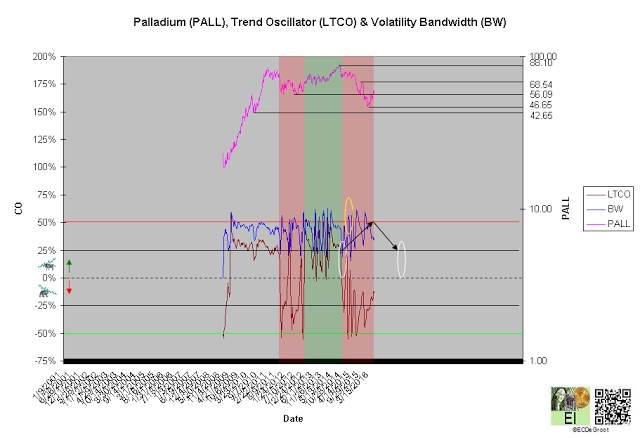
The long-term trend oscillator (LTCO) defines down impulse from 75.29 to 55.05 since the third week of August 2014 (chart 1). The bears control the trend until reversed by a bullish crossover. Compression, the final phase of the CEC cycle, generally anticipates this change.
A close above 68.54 jumps the creek and transitions the trend from cause to mark up, while close below 42.65 breaks the ice and transition it to mark down.
Chart 1
Leverage
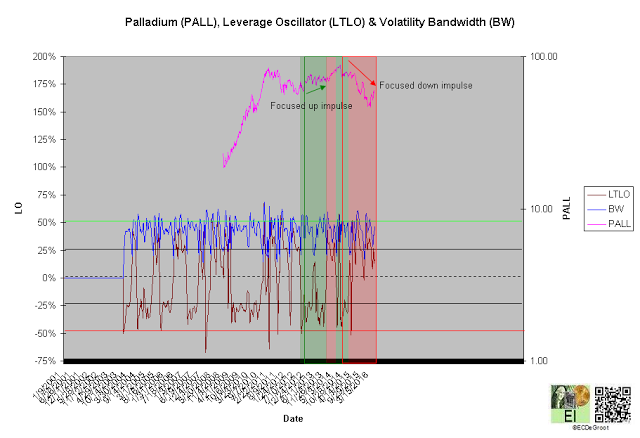
The long-term leverage oscillator (LTLO) defines a bear phase since the second week of November 2015 (chart 2). This focuses the down impulse (see price).
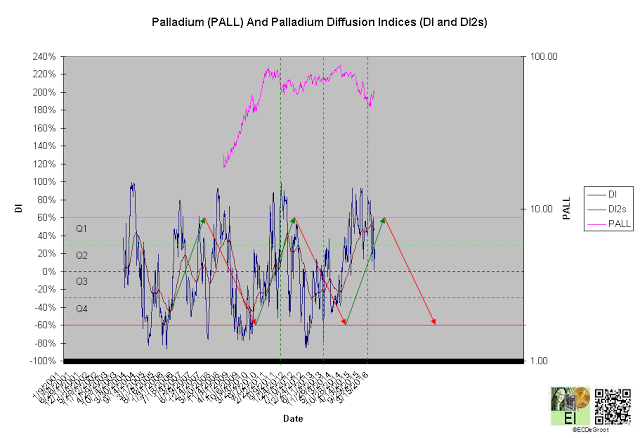
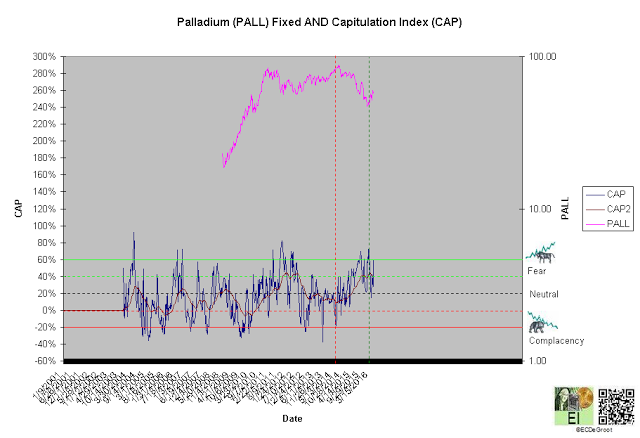
A diffusion index (DI) of 25% defines Q1 accumulation (chart 3). A capitulation index (CAP) of 60% supports this message (chart 4). DI and CAP's trends, broader flows of leverage and sentiment from distribution to accumulation and complacency to fear supporting the bears (green arrows), should not only continue to extreme concentrations but also restrain upside expectations until reversed (see price). A rally under these trends, a sign of strength (SOS), would be bullish for palladium longer-term.
Chart 2
Chart 3
Chart 4
Time/Cycle
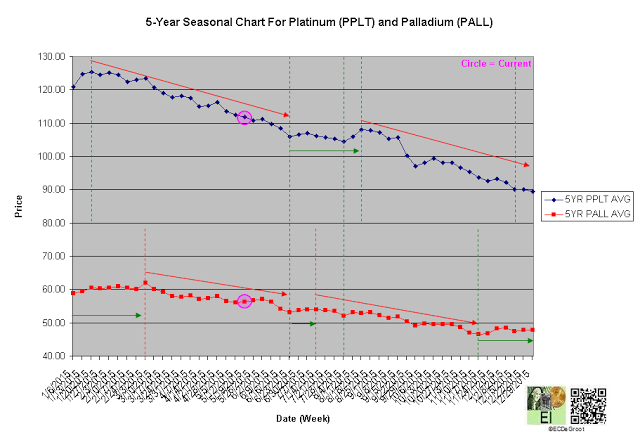
The 5-year seasonal cycle (red series) defines weakness until the fourth week of June (chart 5). This path of least resistance restrains upside expectations (see price).
Chart 5

