Bearish fundamentals, growing stock piles of natural gas consistently above their one- and five-year averages, have been supporting mark down in natural gas (NG) for years. While natural gas's trend is often discussed in terms of supply and demand or 'the fundamentals', a minority of independent thinkers recognize that it's also defined by human behavior.
Investors, largely driven by emotions rather than discipline, tend to focus on volatility rather than the message of the market. This tendency prevents them from recognizing better opportunities in quieter markets.
Insights constructs and interprets the message of the market, the flow of sentiment, price, leverage, and time in order to define trends within the cycle of accumulation and distribution for subscribers.
Summary
The BEAR (Price) and BULL (Leverage) trends under Q2 accumulation during seasonal strength position natural gas (NG) as consolidation/profit-taking against the bear opportunity since the third week of December.
Price
Interactive Charts: United States Natural Gas (NYSE:UNG), NATGAS
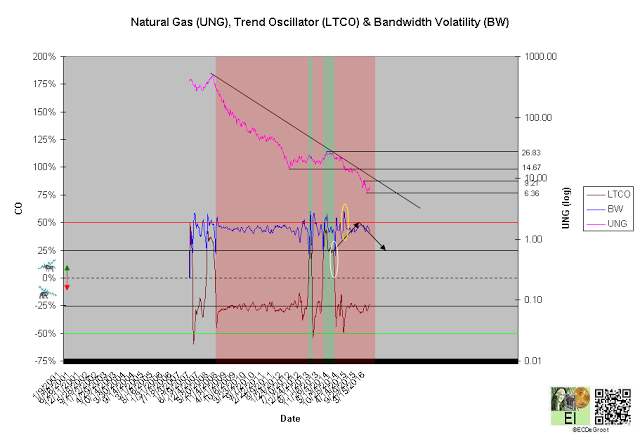
The long-term trend oscillator (LTCO) defines a down impulse from 20.83 to 6.78 since the fourth week of July 2014 (chart 1). The bears control the trend until reversed by a bullish crossover. Compression, the final phase of the CEC cycle, generally anticipates this change.
A close above 14.67 jumps the creek and transitions the trend from mark down to cause.
Chart 1
Leverage
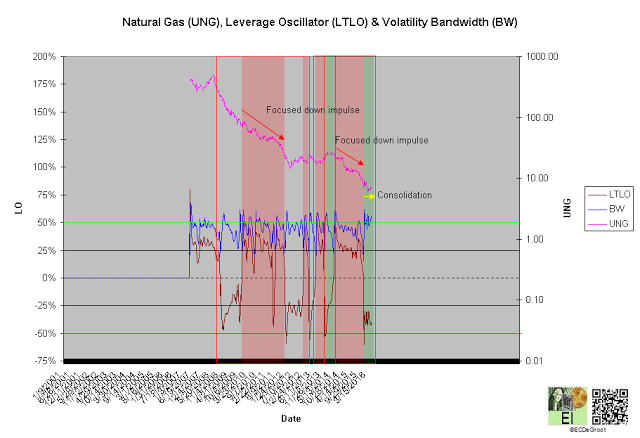
The long-term leverage oscillator (LTLO) defines a bull phase since the third week of December 2015 (chart 2). The bull phase, a conflicting message from the leadership of leverage and price, suggests consolidation/profit-taking against the down impulse (see price). This tightens risk management for the bears.
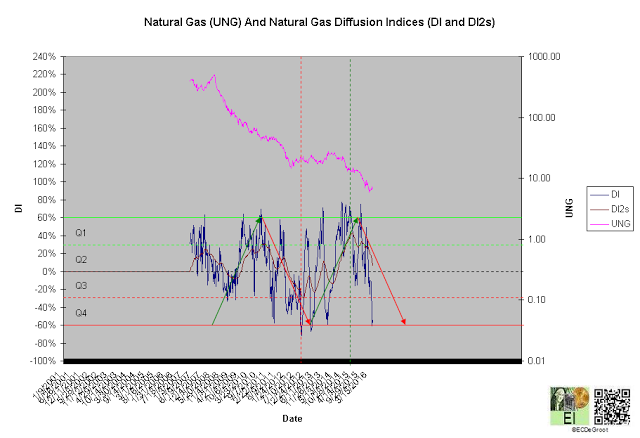
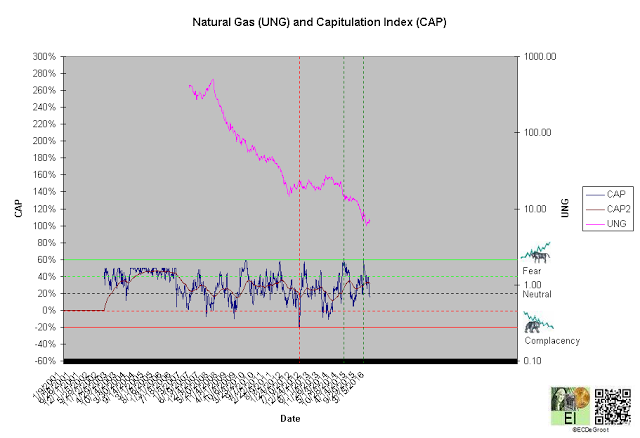
A diffusion index (DI) of -54% defines and Q2 accumulation (chart 3). A capitulation index (CAP) of 15% supports this message (chart 4). DI and CAP's trends, broader flows of leverage and sentiment from accumulation to distribution and fear to complacency supporting the bulls (red arrows), should not only continue to extreme concentrations but also restrain downside expectations until reversed (see price). A decline under these trends, a sign of weakness (SOW) observed since May 2015, would be bearish for NG longer-term (chart 3).
Chart 2
Chart 3
Chart 4
Time/Cycle
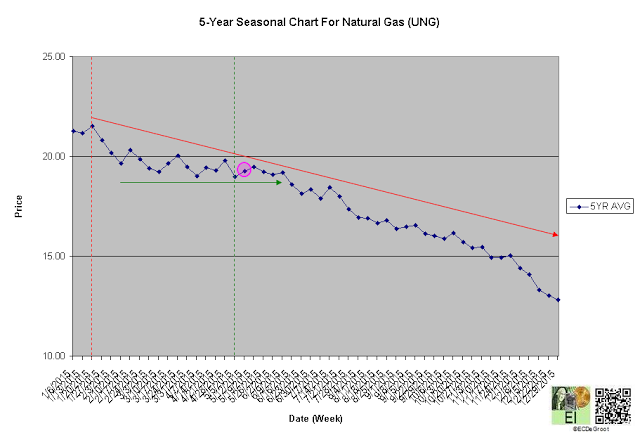
The 5-year seasonal cycle defines an upward bias from May to June (chart 5). This path of least resistance restrains downside expectations (see price).
Chart 5

