Lumber, a leading indicator of domestic and global construction, implies future weakness not only US home construction but also the global economy. The general observation of mark down across the commodity sector despite numerous countertrend rallies suggests deflationary forces and deflation throughout the global economy. This interpretation will gain acceptance when the business cycle transitions from prosperity to liquidation and the public loses money on the expectation that it can be prevented or managed.
Investors, largely driven by emotions rather than discipline, tend to focus on volatility rather than the message of the market. This tendency prevents them from recognizing better opportunities in quieter markets.
Insights constructs and interprets the message of the market, the flow of sentiment, price, leverage, and time in order to define trends within the cycle of accumulation and distribution for subscribers.
Summary
The BEAR (Price) and BEARXO (Leverage) trends under Q2 accumulation after the seasonal high position lumber as an aging bear opportunity. The BEARXO (Leverage) focuses the down impulse again.
Price
Interactive Charts: Lumber, Lumber
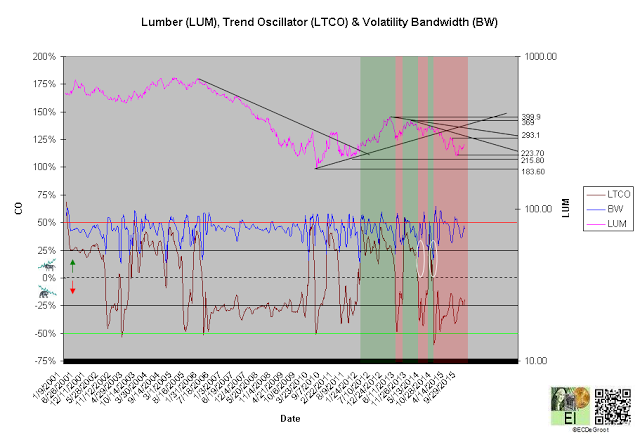
A negative long-term trend oscillator (LTCO) defines a down impulse from 330.90 to 250.40 since the third week of July 2014 (chart 1). The bears control the trend until reversed by a bullish crossover. Compression (white circles) within the CEC cycle generally anticipates this change.
A close above 399.9 jumps the creek and transitions the trend from cause to mark up. A close below 183.60 breaks the ice and transitions the trend to mark down.
Chart 1
Leverage
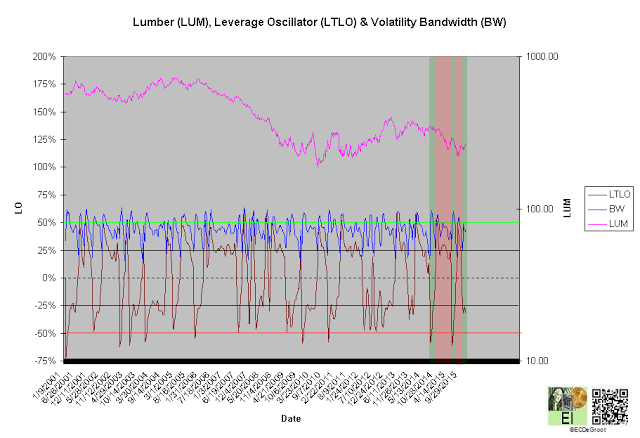
A negative long-term leverage oscillator (LTLO) defines a bearish crossover and bear phase since the fourth week of January (chart 2). The focuses the down impulse (see price).
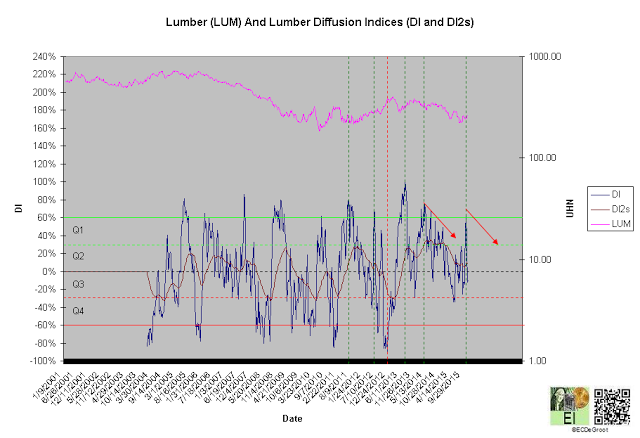
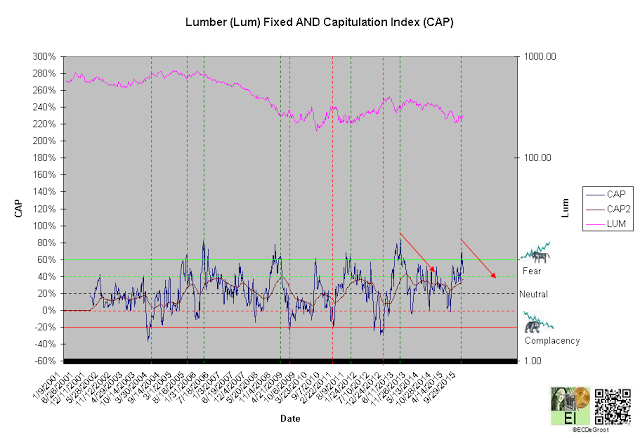
A diffusion index (DI) of 5% defines a Q2 accumulation (chart 3). A capitulation index (CAP) of 37% supports this message (chart 4). DI and CAP's trends, broader flows of leverage and sentiment from extreme accumulation (green dotted line) to distribution and extreme fear (green dotted line) to complacency supporting the bulls (red arrows), should not only continue to extreme concentrations but also restrain downside expectations until reversed (see price). Continuation of the decline under these trends, a sign of weakness (SOW), would be bearish for lumber longer-term.
Chart 2
Chart 3
Chart 4
Time/Cycle
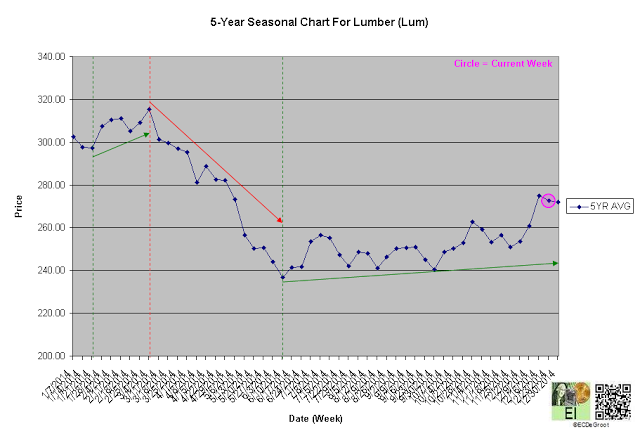
The 5-year seasonal cycle defines strength until the first week of March (chart 5). This path of least resistance restrains downside expectations over the short-term (see price).
Chart 5

