The professional investors must profit by anticipating future trends and events rather than chasing old news. This is done by following the invisible hand or message of the market. That message, the simultaneous study of the the cycle of accumulation and distribution (trend), the distribution, movement, and participation of leverage (leverage), time/cycles, and human behavior void of opinions is defined below:
Trend
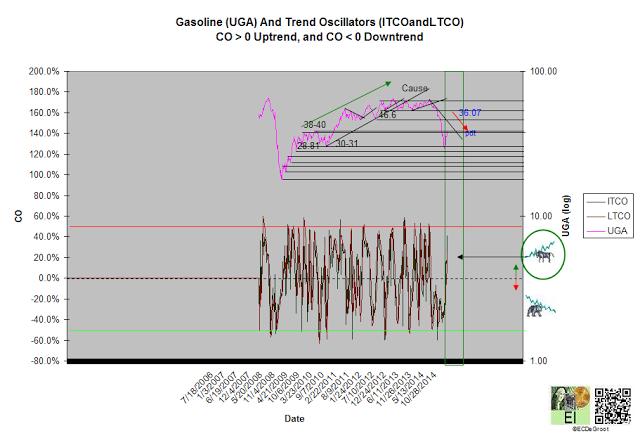
A rising trend which generated a bullish crossover during the third week of February continued to support positive trend oscillators (chart 1). The bulls control the trend as long as the trend oscillators remain positive.
Chart 1
Leverage
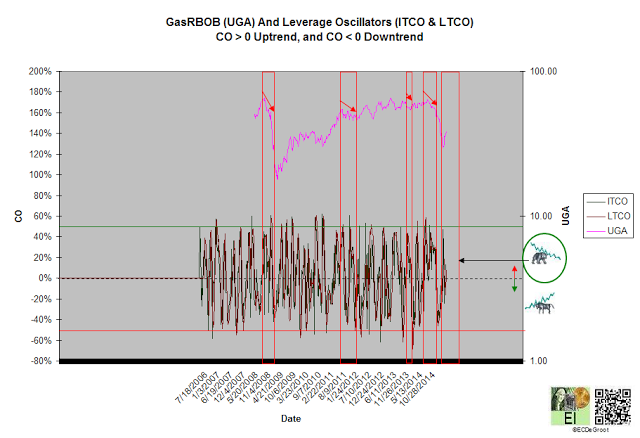
The flow of leverage (red arrow) has defined a bull phase since November (chart 2). February bullish crossover confirmed the phase (see trend).
(NYSE:Gasoline)'s leverage oscillators, holding above zero since January, advise caution for the bulls until reversed by a bearish crossover - down impulse (chart 3). Let the chasers chase strength until the message of the market supports it.
Chart 3
Time/Cycle
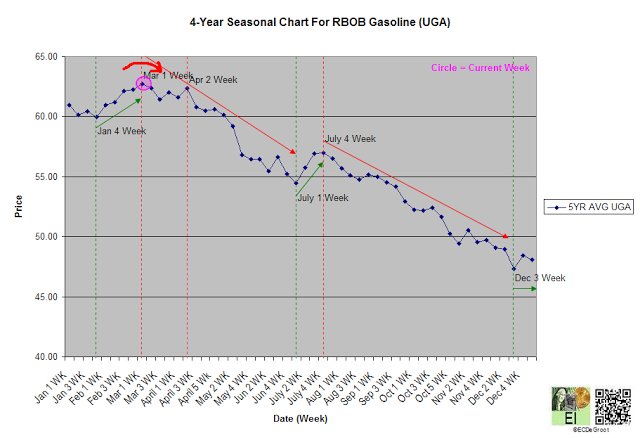
The 5-year seasonal cycle defines strength until the first week of March (chart 4). After that, gasoline enters a topping period that culminates into a early July bottom.
Chart 4

