The cycle of accumulation and distribution defines cause (building) within down phase for the euro.
Traders chasing the euro's bounce should be listening to the message of the market rather than bullish headlines that marginalize the consequences of Greek or other EU member default, or the Fed's decision to postpone hiking interest rates.
According to the Irish Times, EU said to consider plan for Greece in event of Euro exit, Euro leaders view a Greek withdrawal as politically and economically 'containable'.
European officials are considering mechanisms to ring fence Greece both politically and economically in the event of a euro breakup, in order to shield the rest of the currency bloc from the fallout, one of the people said.
The euro's structural flaws make shielding the eurozone from a broader contagion a pipe dream supported by opinions rather than the message of the market. If any EU member, including Greece, exits, devalues, and begins to recover economically, higher-profile members will be pressured to follow as the business cycle clearly transitions from prosperity to liquidation in 2016. A major eurozone panic is only a matter of economic activity, confidence, and time without meaningful structural changes. Implementation of any change is already proving difficult for a union grappling with the social movement from cooperation/(trust) to separation/(distrust) (1,2,3).
At this point, the majority is not interested in the euro or potential trouble within the eurozone. Grexit and/or immigration crisis, events positioned as containable through laws and rules implemented by leaders lacking skills in practical economics, will struggle to find solutions. Smart money is watching for a reversal in the U.S. dollar to signal trouble ahead.
Price
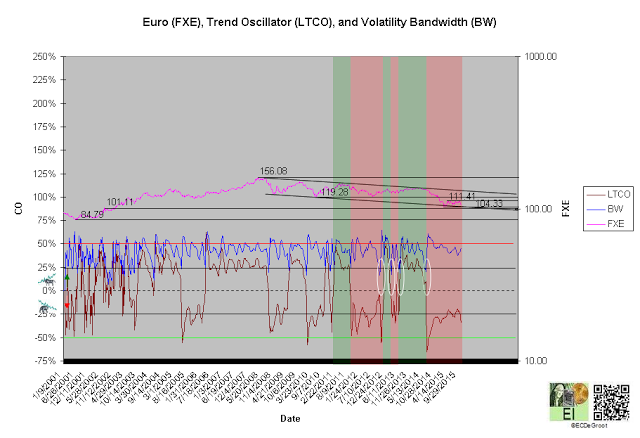
A negative long-term trend oscillator (LTCO) defines a down impulse from 133.44 to 105.27 since the third week of July 2014 (chart 1). The bears control the trend until reversed by a bullish crossover. Compression (white circles) generally anticipates this change.
A close above 119.28 jumps the creek and transitions the trend from cause to mark up. A close below 104.33 breaks the ice and confirms continuation of mark down.
Chart 1
Leverage
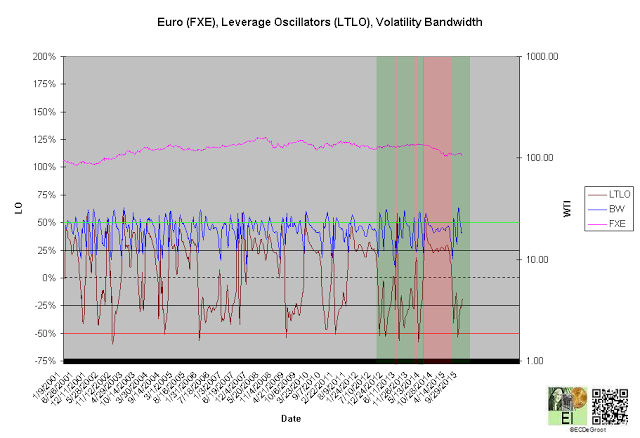
A positive long-term leverage oscillator (LTLO) defines an up impulse and bull phase since the second week of July (chart 2). The bull phase, a conflicting message from the leadership of leverage and price, tightens risk management for the bulls over the short-term (see price).
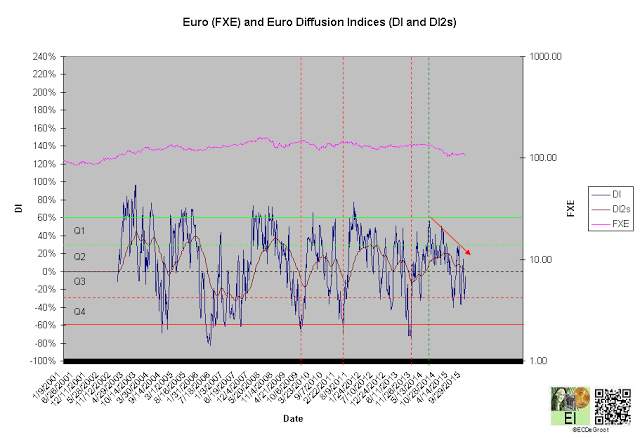
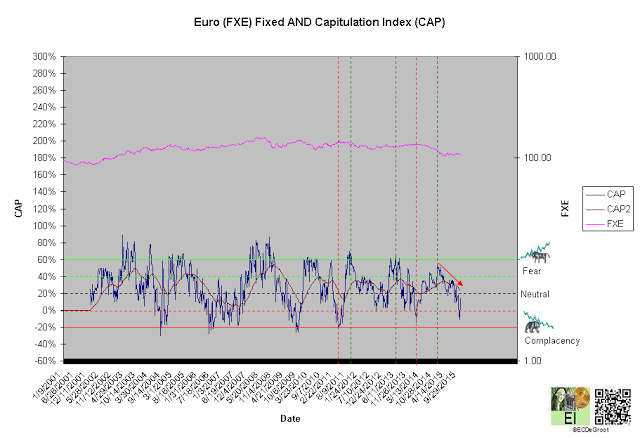
A diffusion index (DI) of -5% defines declining Q2 accumulation (chart 3). A capitulation index (CAP) of 15% supports this message (chart 4). DI and CAP's trends, broader flows of leverage and sentiment from extreme accumulation (green dotted line) to distribution and extreme fear (green dotted line) to complacency supporting the bulls (red arrows), should not only continue to extreme concentrations but also restrain downside expectations until reversed (see price).
Continuation of the decline under these trends represents a SOW, a precursor to a stronger than expected decline when DI and CAP flows reverse.
Chart 2
Chart 3
Chart 4
Time/Cycle
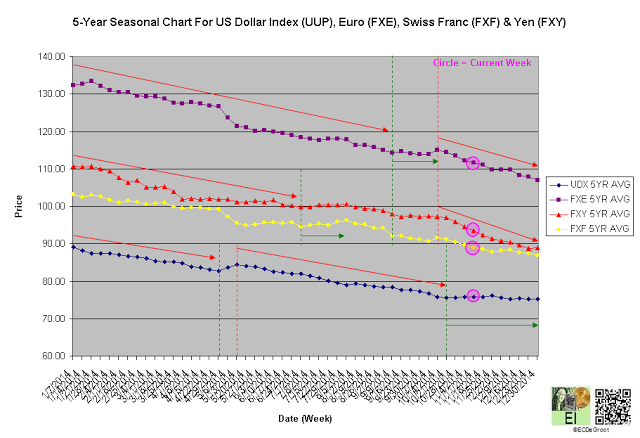
The 5-year seasonal cycle (purple series) defines weakness until the end of the year (chart 5). This path of least resistance restrains upside expectations (see price).
Chart 5

