The cycle of accumulation and distribution defines cause (building) within a broader mark down phase for Cotton.
USDA's weekly Crop Progress report shows cotton lagging behind the 5-year average. This could be due to persistent drought conditions in the West.
California Cotton, while never king, has always been an important crop for the West; Californian produces by far the most Pima cotton (known for its extra-long premium fiber) in the U.S. Production, however, continues to decline, as farmers find it increasingly hard to support during the ongoing drought.
Insights follows interplay of price, leverage, time, and sentiment (click for further discussion of Reviews) to help recognize the transition from cause (building) to mark up or mark down for subscribers.
Price
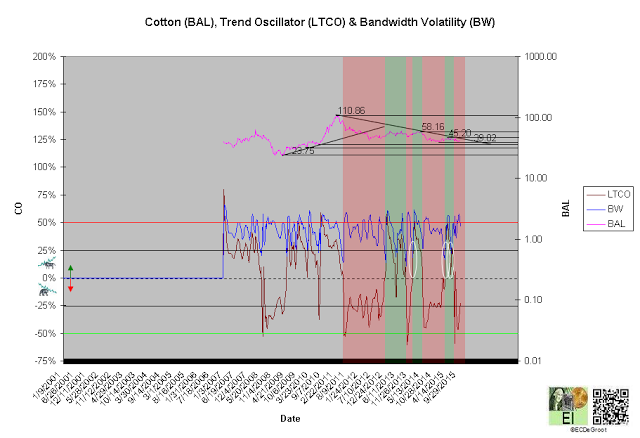
A negative long-term trend oscillator (LTCO) defines a down impulse from 42.17 to 41.85 since the fourth week of August (chart 1). The bears control the trend until reversed by a bullish crossover. Compression, highlighted by white circles, generally anticipates change.
A close above 58.16 jumps the creek and transitions the trend from cause to mark up. A close below 39.02 breaks the ice and returns the trend to mark down.
Cotton's trend, a comparison of down (red boxes) versus up (green boxes) impulses, defines a non-trending market and a source of profit for bears since 2012.
Chart 1
Leverage
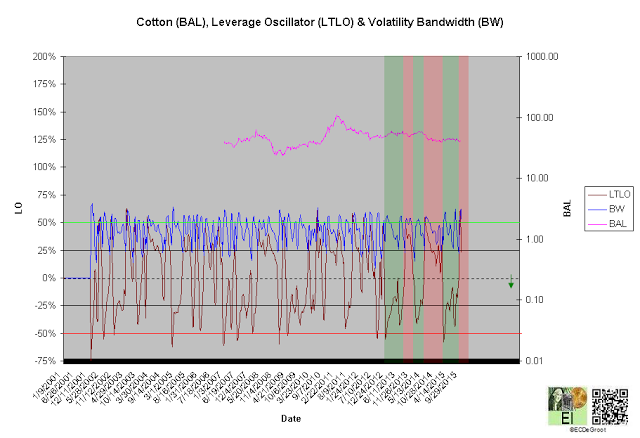
A positive long-term leverage oscillator (LTLO) defines an up impulse and bear phase since the third week of September (chart 2). This support the decline (see price).
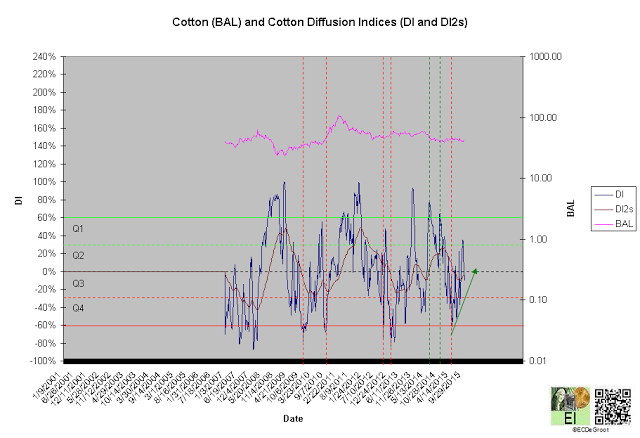
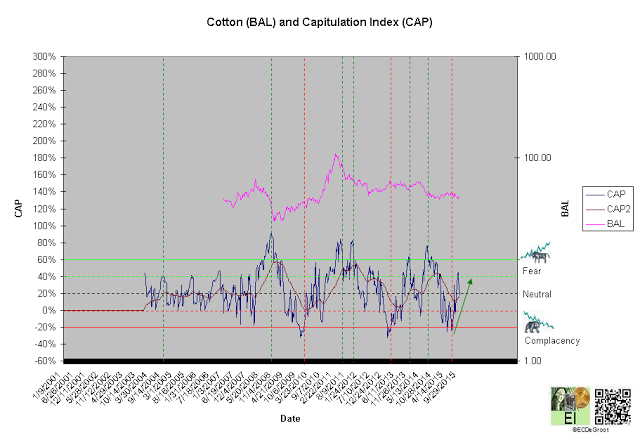
A diffusion index (DI) of -10% defines Q3 distribution (chart 3). A capitulation index (CAP) of 17% supports this message (chart 4). DI and CAP's trends, broader flows of leverage and sentiment from extreme distribution (red dotted line) to accumulation and extreme complacency (red dotted line) to fear supporting the bears (green arrows), should not only continue to extreme concentrations but also restrain upside expectations until reversed (see price).
Chart 2
Chart 3
Chart 4
Time/Cycle
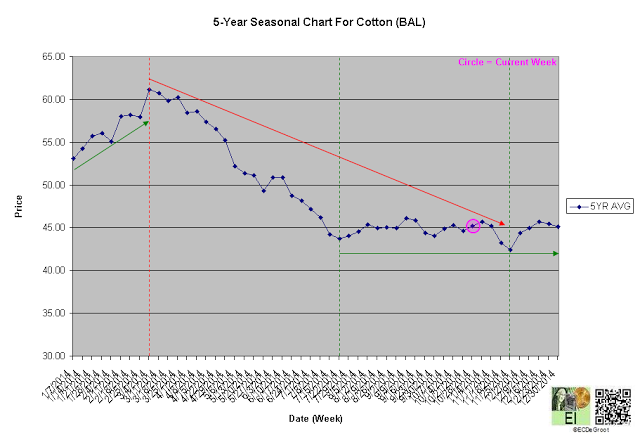
The 5-year seasonal cycle defines sideways chop - neither well define strength or weakness until the end of the year (chart 5). This path of least resistance supports non-trending trading tactics (see price).
Chart 5

