The cycle of accumulation and distribution defines cause (building) within a broader mark down phase for cotton.
USDA's weekly Crop Progress report shows cotton lagging behind the 5-year average. This could be due to persistent drought conditions in the West.
California Cotton, while never king, has always been an important crop for the West; Californian produces by far the most Pima cotton (known for its extra-long premium fiber) in the U.S. Production, however, continues to decline, as farmers find it increasingly hard to support during the ongoing drought.
Cotton (BAL), mired in a lackluster countertrend rally since early 2015, should be followed.
Trend
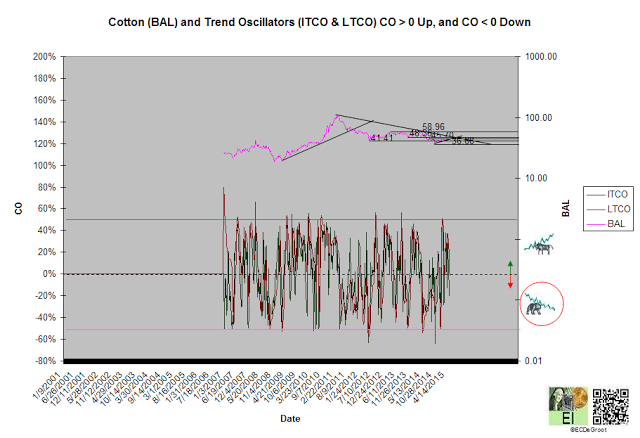
Negative trend oscillators define a down impulse and fresh decline from 43.19 since the first week of June (chart 1). The bears control the trend until this impulse is reversed.
Chart 1
Leverage
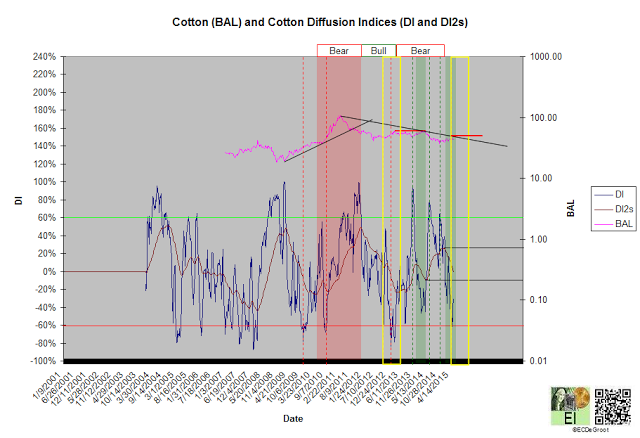
The flow of leverage defines bear phase since April 2014 (chart 2). A DI2 close below its June 2014 low reverses the phase, while a DI2 close above its February high confirms continuation.
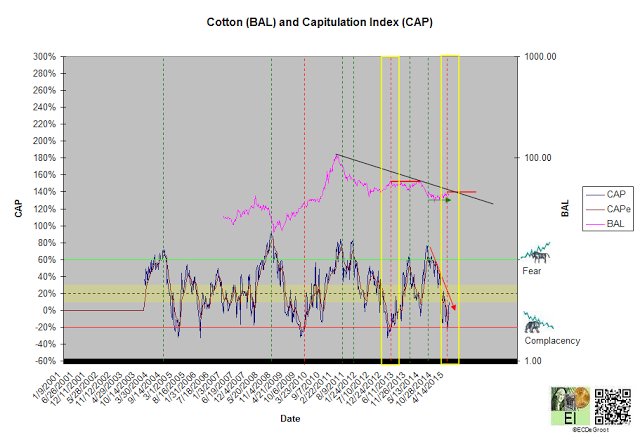
A diffusion index (DI) of-32% maintains the bearish bias. A capitulation index (CAP) of 10% supports this bias and defines an uptick in fear towards neutrality (chart 2A). This modestly bearish combinations tightens risk management for bears that shorted extreme complacency on the first week of May. Clustering of bearish setups, a common observation as DI2 and CAPe decline further - show the accumulation of energy necessary to reverse the countertrend rally, could offer bears additional opportunities to short in the coming months. These trends are highlighted by the yellow boxes (chart 2).
Chart 2
Chart 2A
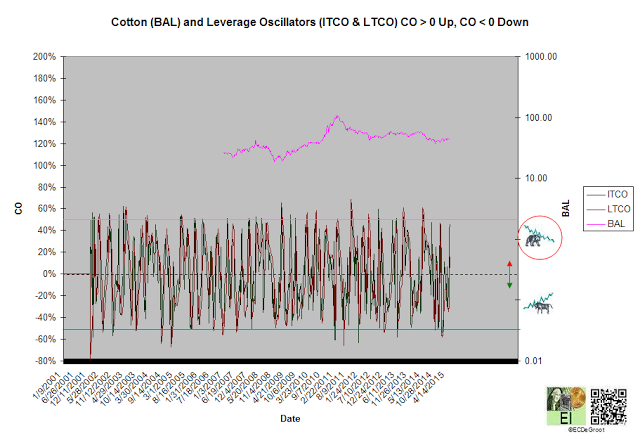
Negative leverage oscillators define an down impulse that opposes the bear phase but supports the bull trend (chart 3).
Chart 3
Time/Cycle
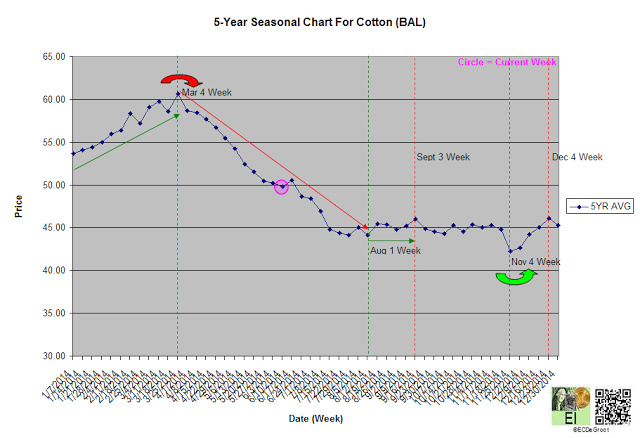
The 5-year seasonal cycle defines weakness until the first week of August (chart 4). A bullish flow of leverage, predominantly negative leverage oscillator readings since late October 2014, has marginalized seasonal tendencies so far (see leverage)
Chart 4

