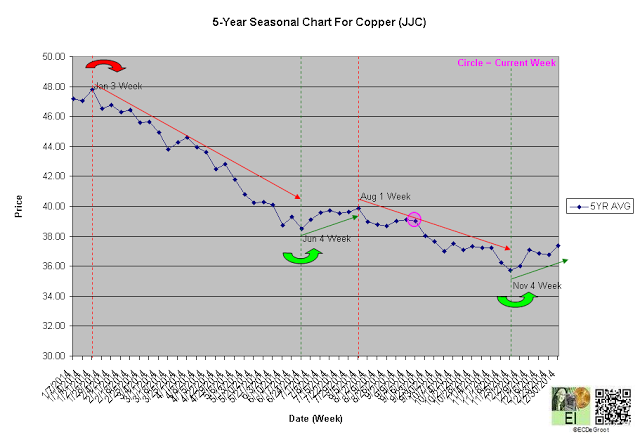
The cycle of accumulation and distribution defines cause (building) within a broader mark down phase for copper. The flow of leverage and sentiment continues to describe a message of change. The majority, a group that believes central planners' policies manage the global economy (not the invisible hand) as directed or follows only price, will likely ignore or miss this message. This leaves the minority of independent thinkers tightening risk management and preparing for change.
A 25 basis point (bp) interest rate cut, the third reduction in six months that follows 100 bp reduction in the reserve requirement and unexpected revaluation of the yuan, extends a coordinated effort to spur global economic growth.
While coordinated 'stimulus' supports a counter-trend rally of commodities foreshadowed by negative concentration discussed months ago, it won't reverse global capital flows regardless of the hype. Eventually, today's largely short covering move will peter out. Copper, an economically-sensitive commodity, should lead a cyclical downturn in the global economy.
Insights follows interplay of price, leverage, time, and sentiment to help recognize the transition from cause (building) to mark up or mark down for subscribers.
Trend
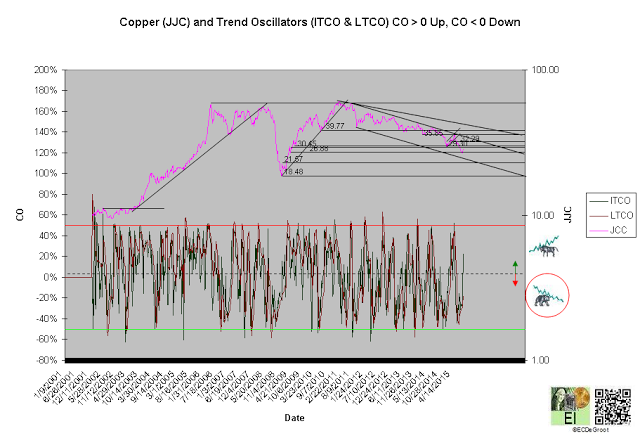
Negative trend oscillators define a down impulse (decline from) 32.39 to 28.67 since the second week of June (chart 1). While the suspension of operations from commodity giant Glencore (LONDON:GLEN) on Monday has a few experts calling for a bottom and the bears worried, it (the news) has yet to reverse the impulse. Smart money knows that the bears control the trend until reversed by bullish crossover.
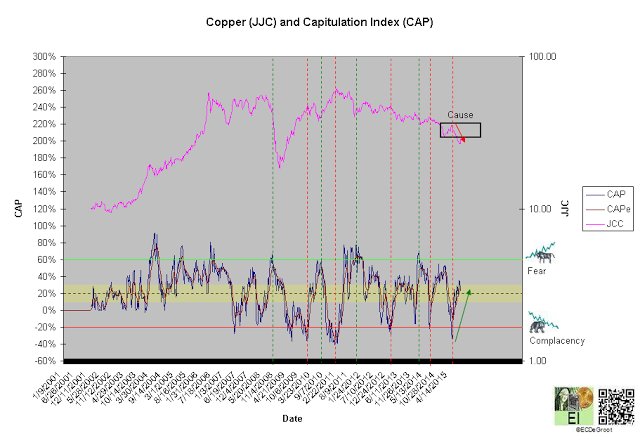
DI and CAP fell as low as -80% and -32% during mid May. These readings, indications of extreme distribution (bearish setups) and sentiment (complacency), favored a change of impulse from up to down (see leverage). A bearish crossover during the second week of June confirmed the change.
A weekly close below 29.60 broke the ice and transitioned the trend from cause to mark down. A weekly close above 29.60; therefore, jumps the creek and returns the trend to cause. A close below 26.80 confirms continuation (of mark down).
Leverage
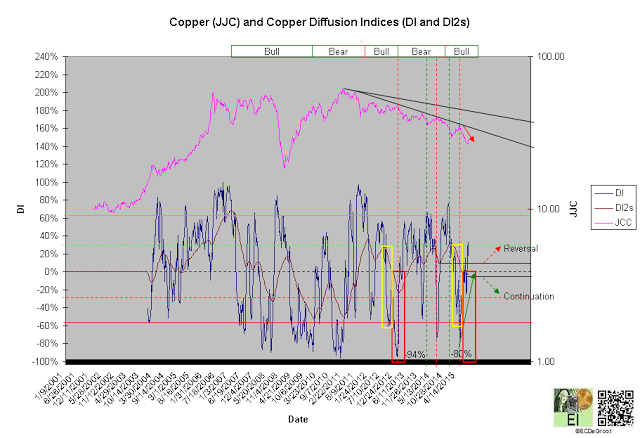
The flow of leverage defines bull phase since December 2014 (chart 2). A DI2 close below its March 2013 low confirms continuation. A DI2 close above its September 2014 low reverses the phase to bears.
A diffusion index (DI) of 18% defines mild accumulation and bullish bias. A capitulation index (CAP) of 22% supports DI's message (chart 2A). These trends, the flow of leverage and sentiment from extreme distribution (-80% DI) to accumulation and complacency (-33% CAP) to fear, support the bears that shorted June's bearish crossover (see trend). The tendency of bullish and bearish setups to cluster should provide additional shorting opportunities if DI and CAP decline as price rallies. The yellow and red boxes highlight this tendency (chart 2).
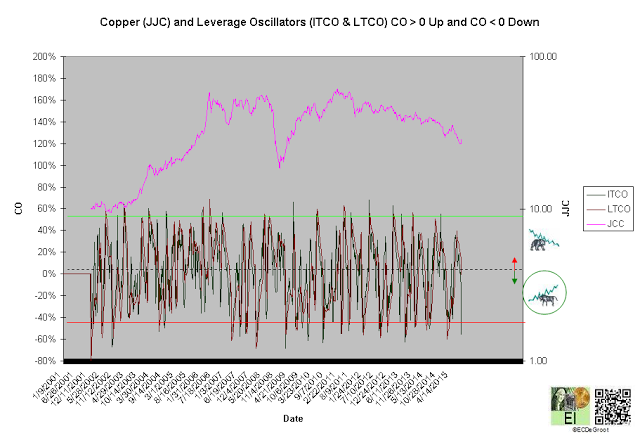
Negative leverage oscillators define an down impulse the supports the bull phase and opposes the bear trend (chart 3). The negative flow of leverage - distribution as price rises supports the expectation of a bullish crossover soon (see trend). Failure to generate one must be recognized as a Sign of Weakness (SOW).
Time/Cycle
The 5-year seasonal cycle defines weakness until the fourth week of November - the fall transition (chart 4). Cause building, countertrend rally, churn or sideways chop, could generate additional bearish setups or clusters (see leverage) necessary to fuel a more organized decline into the fall transition.

