While coordinated 'stimulus' supports a countertrend rally of commodities foreshadowed by negative concentration discussed months ago, it won't reverse global capital flows regardless of the hype. Copper, an economically-sensitive commodity, has been leading a cyclical downturn in the global economy for months. While this and other bearish commodity trends are well recognized among industry leaders, they continues to elude the public, a majority that generally believes the US economy remains on solid footing. The majority, a day late and dollar short in terms of timing, will panic only after undeniable economic contraction completely invalidates their beliefs.
Insights constructs and interprets the message of the market, the flow of sentiment, price, leverage, and time in order to define trends within the cycle of accumulation and distribution for subscribers.
Summary
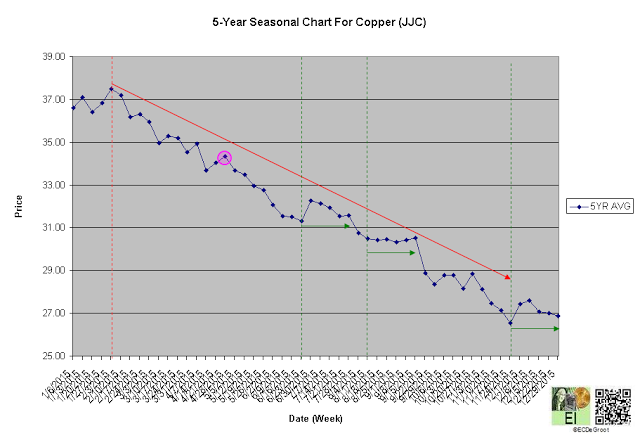
The BEAR (Price) and BULL (Leverage) trends under Q3 distribution after the seasonality high position copper as consolidation/profit-taking against the bear opportunity since the second week of March.
Price
Interactive Charts: iPath Bloomberg Copper Subindex Total Return Exp 22 Oct 2037 (NYSE:JJC)
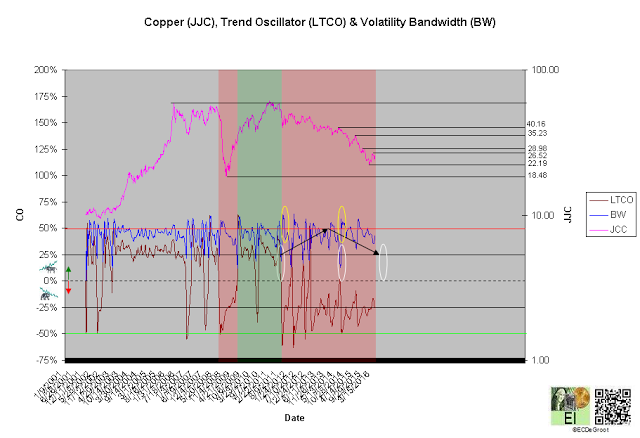
A negative long-term trend oscillator (LTCO) defines a down impulse from 38.78 to 26.24 since the first week of August 2014 (chart 1). The bears control the trend until reversed by a bullish crossover. Compression, the final phase of the CEC cycle, generally anticipates this change.
A close above 28.98 jumps the creek and transitions the trend from long-term cause to mark up, while a close below 18.48 breaks the ice and transitions it to mark down.
Chart 1
Leverage
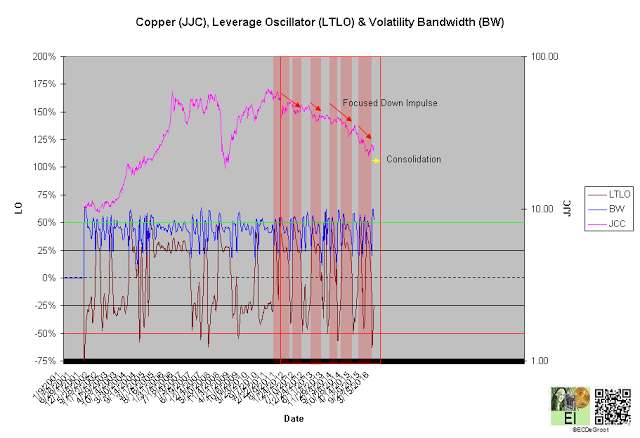
A negative long-term leverage oscillator (LTLO) defines a bull phase since the second week of March (chart 2). The bull phase, a conflicting message from the leadership of leverage and price, defines consolidation/profit-taking against the down impulse (see price).
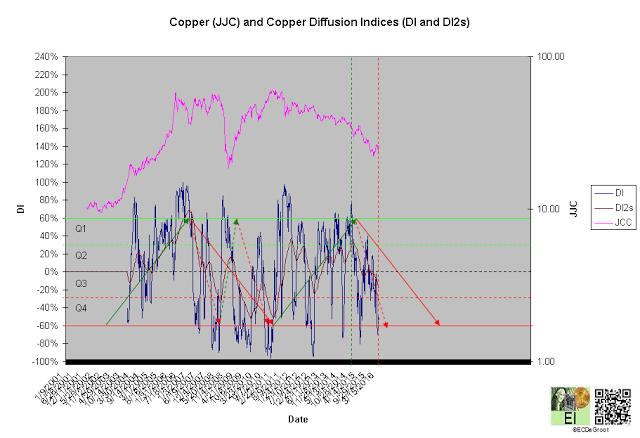
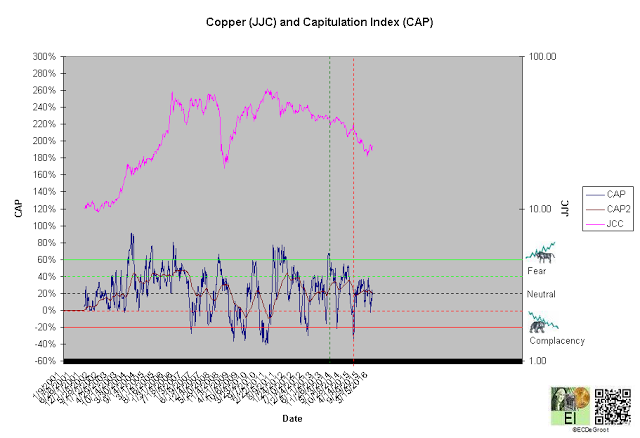
A diffusion index (DI) of -54% defines a bearish setup and Q3 distribution (chart 3). A capitulation index (CAP) of 18% supports this message (chart 4). DI and CAP's trends, broader flows of leverage and sentiment from accumulation to distribution and fear to greed supporting the bulls (red arrows), should not only continue to extreme concentrations but also restrain downside expectations until reversed (see price). A decline under these trends, a sign of weakness (SOW) observed since early 2015, would be bearish for copper longer-term.
Chart 2
Chart 3
Chart 4
Time/Cycle
The 5-year seasonal cycle defines weakness until the fourth week of June (chart 5). This path of least resistance restrains upside expectations (see price).
Chart 5

