The cycle of accumulation and distribution defines cause (building) for the British pound (NYSE:FXB).
The British pound, despite a bullish oscillation of leverage and sentiment (see leverage) that continues to lead an intensification of the Greece crisis, will likely resume its mark down once the dollar jumps the creek of cause. Traders looking to anticipate changes in the pound; therefore, should be following cause building the US Dollar Index. Further discussion of the dollar's technical setup can be found in the most recent Review of the US Dollar Index.
Trend
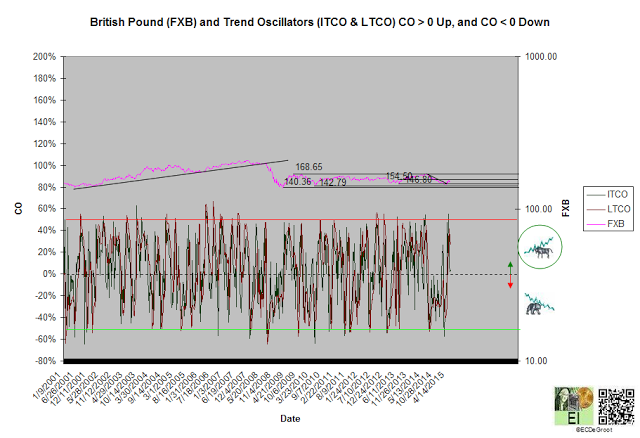
Positive trend oscillators have defined an up impulse and countertrend rally within cause from 147.78 to 150.22 since the first week of May (chart 1). The bulls control the trend until this impulse is reversed.
A weekly close above 154.50 maintains the countertrend rally. A weekly close below 137.50 breaks the ice of cause and denotes the return of mark down. This technical breakdown signals to Americans looking to buying London properties at lower prices to prepare their shopping lists. Growing fear and time will benefit American buyers.
Chart 1
Leverage
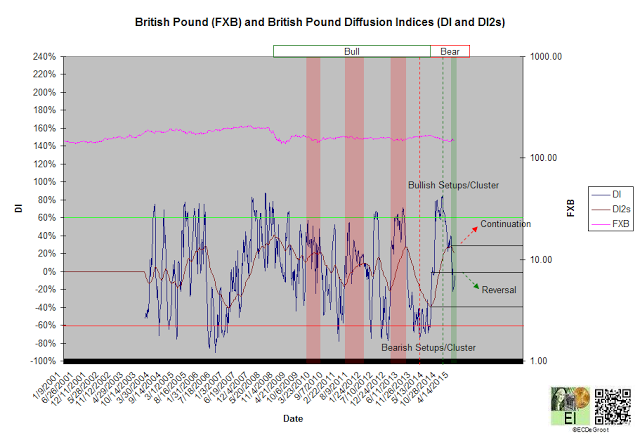
The flow of leverage defines a bear phase since August 2014 (chart 2). DI2's down impulse from the April high defines downtick supporting the rally within cause. A DI2 close above this high (April 2015) confirms continuation of the bear. A DI2 close below the August 2014 congestion reverse the phase.
A diffusion index (DI) of -4% defines mild distribution and growing bearish bias. A capitulation index (CAP) of 24%, a neutral reading, supports DI's message (chart 2A). This setup, the flow of leverage and sentiment from fear to complacency that favors continuation of the rally, tightens risk management for bears that did not reverse shorts after May's bullish crossover (see trend).
Chart 2
Chart 2A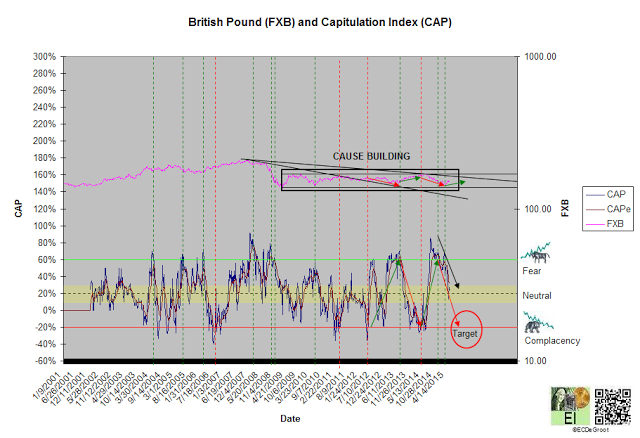
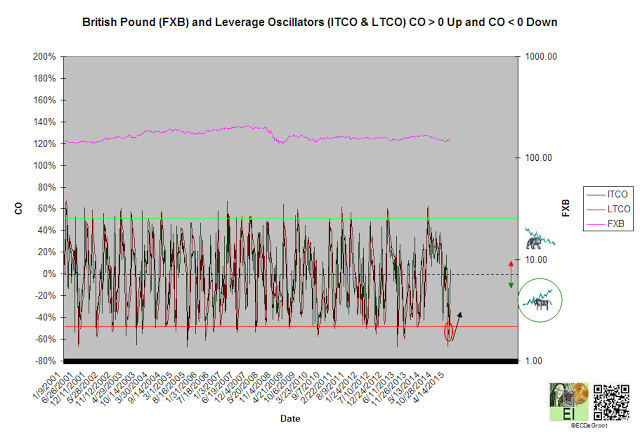
Negative leverage oscillators defines a down impulse that opposes the bear phase and supports the bull trend (chart 3). The probability of short-term profit-taking declines as overbought (OB) unwinds.
Chart 3
Time/Cycle
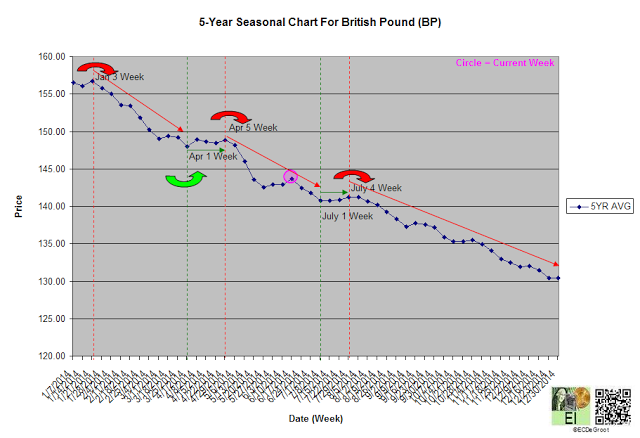
The 5-year seasonal cycle defines weakness until the first week of July (chart 4). Seasonal weakness into the summer transition could be minimized by the flow of leverage and sentiment from fear to complacency. This flow is defined by the capitulation index (see leverage).
Chart 4
- English (UK)
- English (India)
- English (Canada)
- English (Australia)
- English (South Africa)
- English (Philippines)
- English (Nigeria)
- Deutsch
- Español (España)
- Español (México)
- Français
- Italiano
- Nederlands
- Português (Portugal)
- Polski
- Português (Brasil)
- Русский
- Türkçe
- العربية
- Ελληνικά
- Svenska
- Suomi
- עברית
- 日本語
- 한국어
- 简体中文
- 繁體中文
- Bahasa Indonesia
- Bahasa Melayu
- ไทย
- Tiếng Việt
- हिंदी
Pound Continues To Lead Intensification Of Greece Crisis
Published 06/17/2015, 08:01 AM
Pound Continues To Lead Intensification Of Greece Crisis
Latest comments
Loading next article…
Install Our App
Risk Disclosure: Trading in financial instruments and/or cryptocurrencies involves high risks including the risk of losing some, or all, of your investment amount, and may not be suitable for all investors. Prices of cryptocurrencies are extremely volatile and may be affected by external factors such as financial, regulatory or political events. Trading on margin increases the financial risks.
Before deciding to trade in financial instrument or cryptocurrencies you should be fully informed of the risks and costs associated with trading the financial markets, carefully consider your investment objectives, level of experience, and risk appetite, and seek professional advice where needed.
Fusion Media would like to remind you that the data contained in this website is not necessarily real-time nor accurate. The data and prices on the website are not necessarily provided by any market or exchange, but may be provided by market makers, and so prices may not be accurate and may differ from the actual price at any given market, meaning prices are indicative and not appropriate for trading purposes. Fusion Media and any provider of the data contained in this website will not accept liability for any loss or damage as a result of your trading, or your reliance on the information contained within this website.
It is prohibited to use, store, reproduce, display, modify, transmit or distribute the data contained in this website without the explicit prior written permission of Fusion Media and/or the data provider. All intellectual property rights are reserved by the providers and/or the exchange providing the data contained in this website.
Fusion Media may be compensated by the advertisers that appear on the website, based on your interaction with the advertisements or advertisers.
© 2007-2025 - Fusion Media Limited. All Rights Reserved.

