A rising US dollar and falling commodity prices should continue to pressure the Australian dollar at least for the next few years. Similar declines are playing out across the commodity market. Aussies capacity to hold 70 despite, despite deteriorating 'fundamentals', has been frustrating the bears since early September. The Aussie's unexpected strength, liken to a vampire that just refuses to die by the bears, will dissipate once the flow of leverage and sentiment concentrate and reverse in the months ahead.
Interactive Chart: Guggenheim CurrencyShares Australian Dollar (N:FXA)
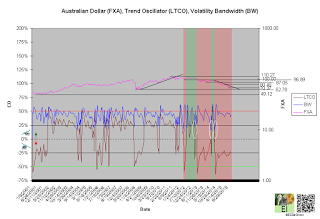
A negative long-term trend oscillator (LTCO) defines a down impulse from 90.47 to 72.57 since the second week of September 2014 (chart 1). The bears control the trend until reversed by a bullish crossover. Compression (white circles) generally anticipates this change.
A close above 96.89 jumps the creek and transitions the trend from cause to mark up. A close below 62.78 breaks the ice and confirms continuation of mark down.
Chart 1
Leverage
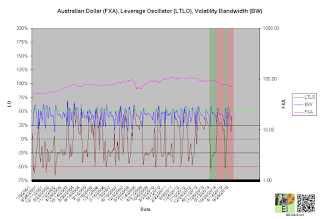
A positive long-term leverage oscillator (LTLO) defines an up impulse and bear phase since the second week of July (chart 2). This supports the decline (see price).
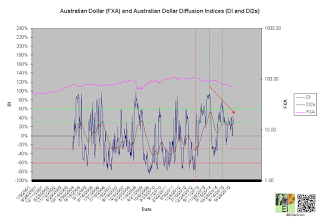
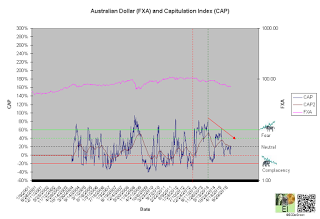
A diffusion index (DI) of 26% defines Q2 accumulation (chart 3). A capitulation index (CAP) of 13% supports this message (chart 4). DI and CAP's trends, broader flows of leverage and sentiment from extreme accumulation (green dotted line) to distribution and extreme fear (green dotted line) to complacency supporting the bulls (red arrows), should not only continue to extreme concentrations but also restrain downside expectations until reversed (see price).
Continuation of the decline within these trends represents a sign of weakness (SOW). This is bearish for Aussie longer-term.
Chart 2
Chart 3
Chart 4
Time/Cycle
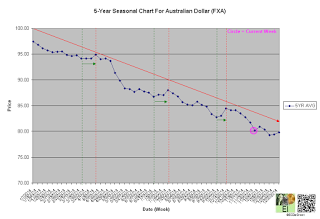
The 5-year seasonal cycle defines weakness until the end of the year (chart 5). This path of least resistance restrains upside expectations (see price).
Chart 5

