
The picture in recent months has been one of European weakness and US strength, but that divergence was reversed yesterday when the final purchasing managers indices (PMIs) for Europe were revised upwards (although still showing contraction) while the Institute of Supply Management (ISM) index in the US came out surprisingly weak (indeed below the 50 “boom or bust” line that signifies expansion or contraction). The orders and production gauges fell sharply to levels consistent with moderate paces of decline in response to slower overseas and domestic demand, while the employment index was little changed at a sluggish level. The figure sent Treasury yields sharply lower, dragging the dollar down with them. Treasuries later lost most of the gains and stocks finished higher, indicating that investors didn’t think the data required any major rethinking of views, but the dollar remained lower against most currencies nonetheless.
While the ISM figures were not supportive of the dollar, comments from San Francisco Fed President Williams and Atlanta Fed President Lockhart were. These two placed slightly more importance than usual on inflation risks after the record low core PCE inflation number on Friday, but their main focus was on the impact that rising confidence would have in improving growth in jobs and the overall economy supporting a start to QE tapering soon. Lockhart indicated that he is confident enough in the recovery that a slowing in nonfarm payrolls growth below 160k a month would give him only “a little pause” rather than force a re-think. Note that these two are both generally moderate in their policy views, ranking two out of five on the Reuters “Dove/Hawk Scale.”
With even FOMC members like this thinking like this, US monetary policy is going to have a different bias than policy in other countries and USD should remain well supported. For example, the Reserve Bank of Australia today left its benchmark rate unchanged at a record low, as expected, and said that there is scope for further easing because of the benign inflation outlook. Here in Europe, analysts are looking for more easing measures from the ECB, if not this week then in coming months. Market participants may want to consider buying USD dips, bearing in mind that speculative investors probably have further to go towards reducing their extreme short positions in some currencies as shown in the weekly Commitment of Traders report from the US (see table on right).
After yesterday’s surprising PMIs, no such dramatic information is due today. Eurozone PPI for April is expected to come with another 0.2% mom decline, which would bring the yoy rate of change down to +0.2%, vs +0.7% in March. The absence of pipeline inflation pressures is not likely to change the ECB’s view, however. The US trade deficit is forecast to have widened back to a more usual level of $41.0bn in April after the sharply narrowed $38.8bn deficit in March.
In the US, Kansas City Fed President George speaks on the US economy and Dallas Fed President Fisher speaks on monetary policy. In contrast with yesterday’s Fed speakers, who had relatively low dove/hawk ratings, George rates a four and Fisher tops the league with a five. Hence today’s speeches are likely to be even more hawkish than yesterday’s, which could support the dollar by reaffirming the likelihood of some “tapering off” of QE.
The Market
EUR/USD 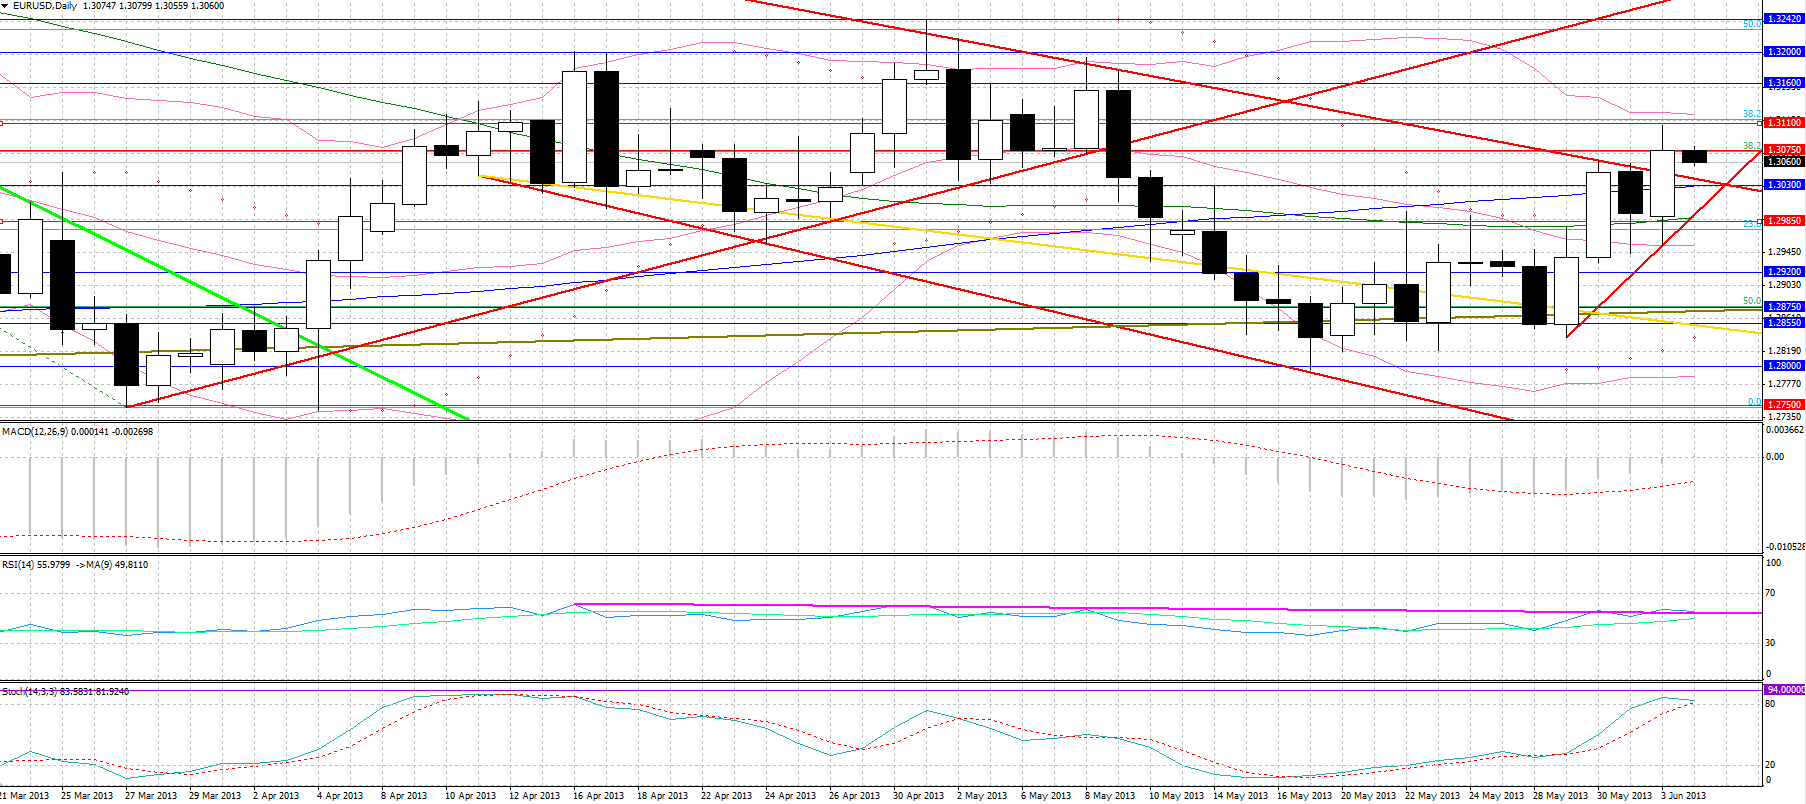 EUR/USD" title="EUR/USD" width="1806" height="804">
• EUR/USD found early morning resistance at 1.3030 following the across-the-board better-than-expected, improved, yet still contractionary Eurozone Manufacturing PMIs. A short-lived retracement to 1.2955 was the consequence of a strong US Markit Manufacturing PMI, but the more closely followed ISM reading was the lowest contractionary figure since July 2009, when the economy was recovering from its bottoming out. The negative surprise caused a breakout from 1.3030, with the pair breaking above its spike trendline that extended from its February high, finding spike resistance at 1.3110, the 38.2% retracement level of its February – March dive, before consolidating at 1.3075. The 200-day MA at 1.3030 is likely to act as an initial support today, with a disinflationary yoy Eurozone PPI weakening the euro, possibly causing the pair to find spike trendline support at 1.2985, which coincides with its 50-day MA. Resistance above 1.3075 and 1.3110 comes at 1.3160, with the RSI closing yesterday above its 1 ½ - month resistance trendline, while the Stochastic lies well into overbought territory.
USD/JPY 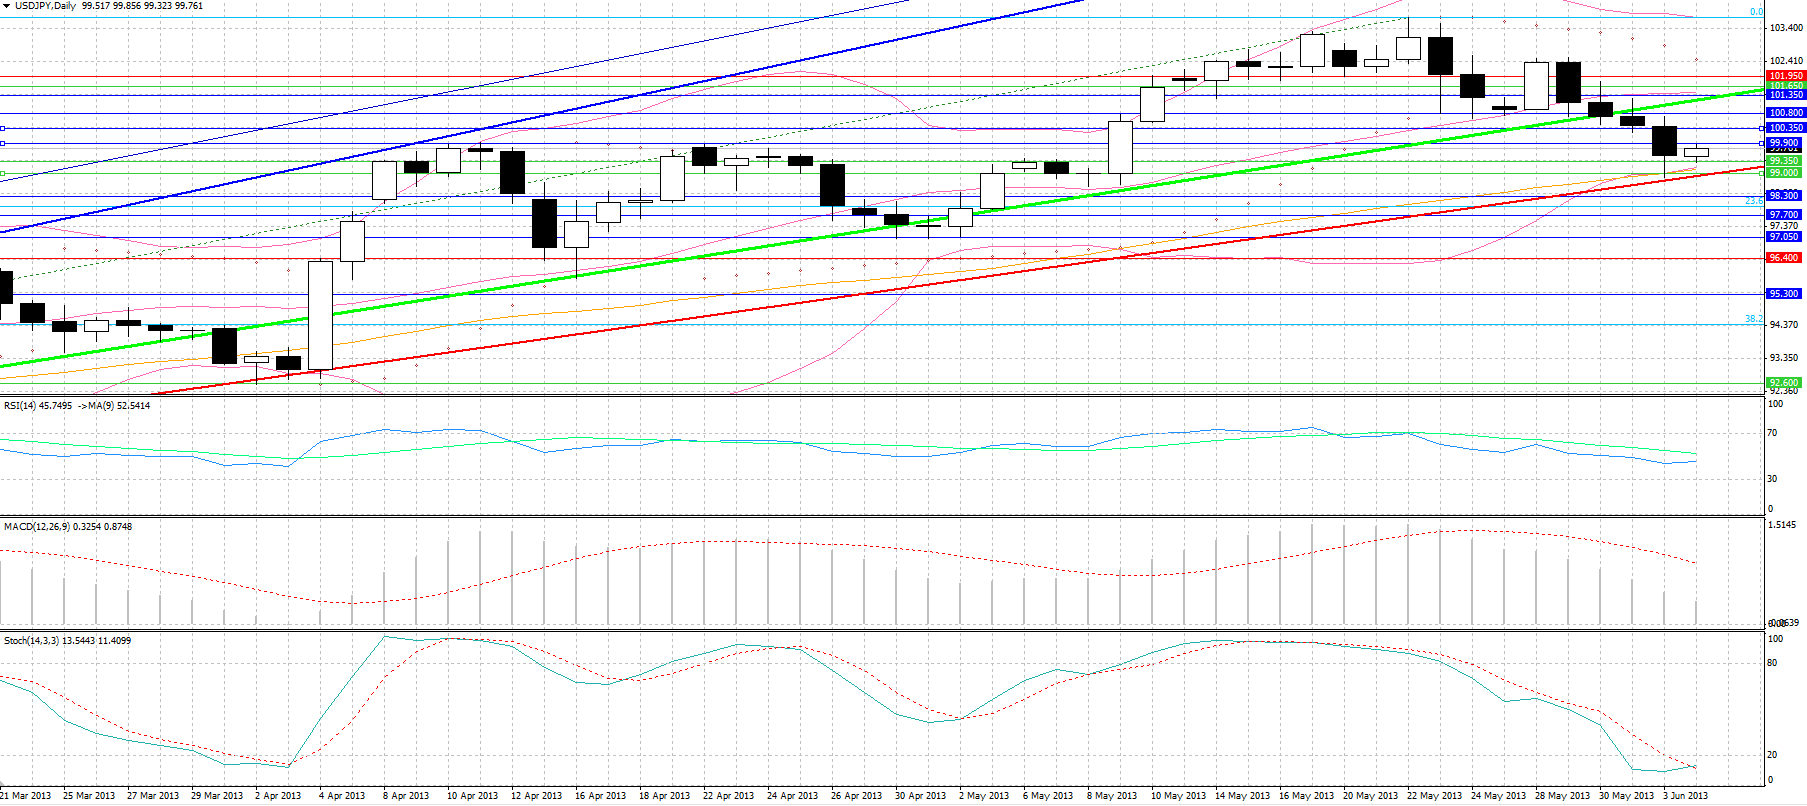 USD/JPY" title="USD/JPY" width="1807" height="806">
• USD/JPY broke down from the 100-level following the weak US ISM report, with the pair finding spike trendline support from its November rally at 98.80, before rebounding only to find yet again resistance just below the 100-mark. The pair then tracked the Nikkei down to 99.35 support. Some resistance above 100 may come at 100.35, with further resistance at 100.80. Spike trendline and lower Bollinger band support is likely to come at 99.00, with a breakdown from that level driving the pair towards 98.30 support.
AUD/USD 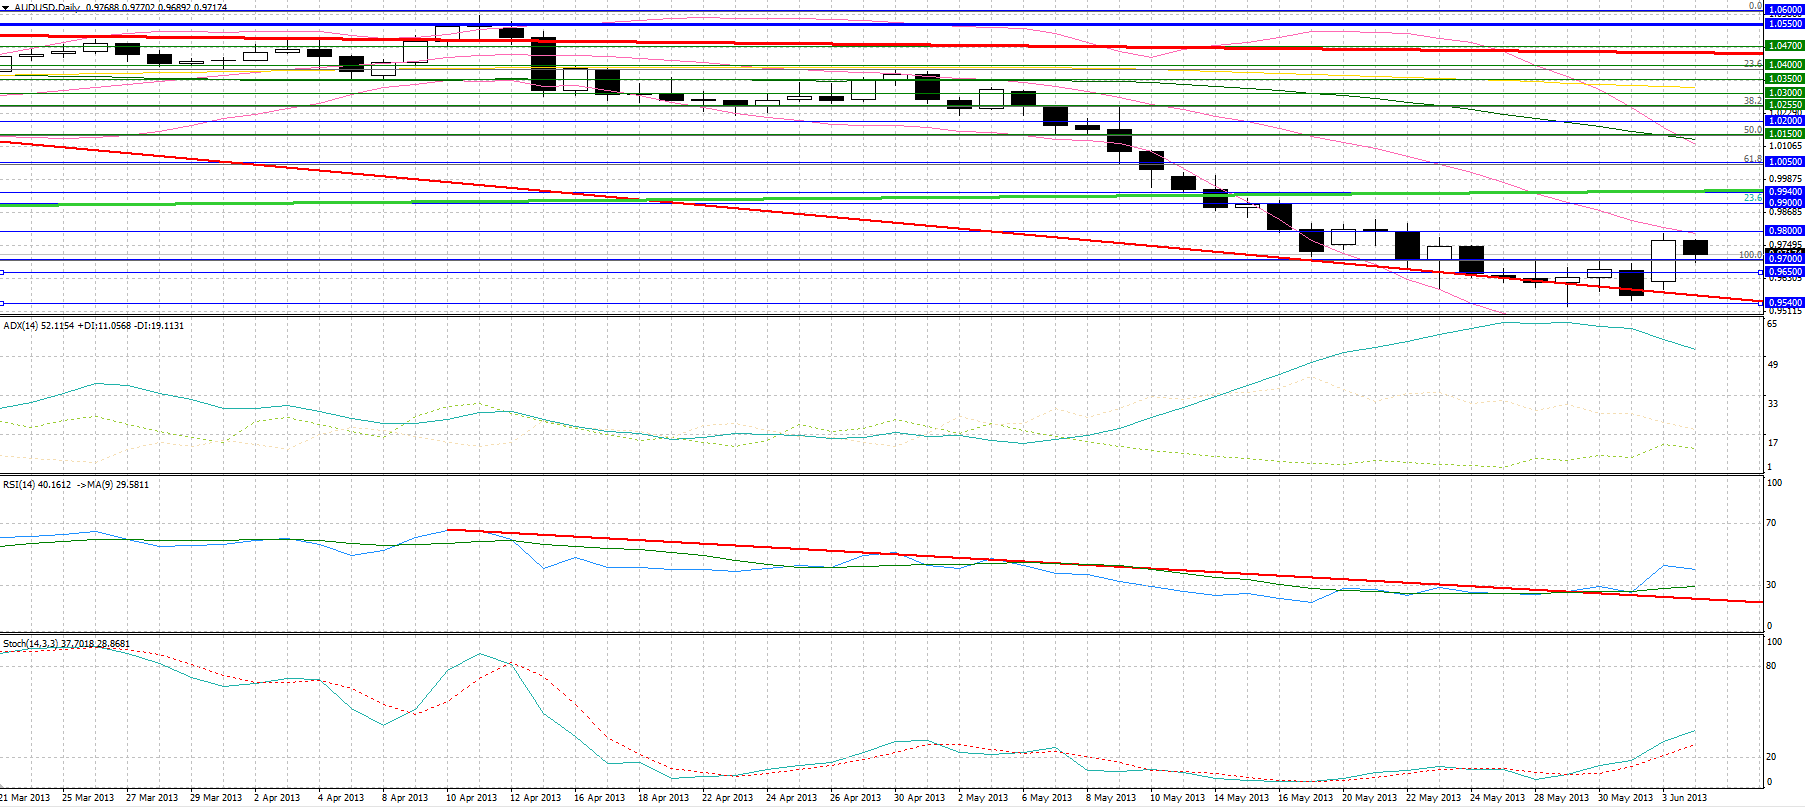 AUD/USD" title="AUD/USD" width="1805" height="807">
• AUD/USD has rebounded from 0.9540 2 ½ year low support, finding yesterday resistance at 0.9800. The expected unchanged rate announcement caused no significant movement in the pair, which experienced its major gains yesterday following the announcement of the U.S. ISM PMI. Support came at the 0.9700 reversal level with further support likely coming at 0.9650. Resistance above 0.9800 will likely come in the 0.9900 – 0.9940 area, with spike support below 0.9540 seen considerably lower at 0.9430.
Gold
• Gold continued with its uptrend as clearly seen on its 4-hour chart, breaking out from $1400 but failing to reach $1423, its 38.2% retracement level of its April crash. $1400 is a clear support level with the $1385 – 1390 acting as a likely spike support area. Resistance above the $1423 – 1431 area comes at the significant $1445 level, the 38.25% retracement level of the post Lehman Bros. gold rally.
Oil
• WTI was a major gainer yesterday, capitalising on the poor USD as the DXY lost 0.62% over the past 24-hours. The rebound from $91.30 support came following the improved Eurozone PMI figures, which weakened the dollar, with resistance coming at the 50-day MA at $93.60, after the release of the U.S. ISM reading, which caused severe downward pressures on the dollar on anticipation that the tapering off of QE may be moved into autumn, at best. Initial support comes at $92.35, the 200-day MA, with further support at $91.30, with resistance coming at $94.05 and $94.50.
BENCHMARK CURRENCY RATES - DAILY GAINERS AND LOSERS
MARKETS SUMMARY
- English (UK)
- English (India)
- English (Canada)
- English (Australia)
- English (South Africa)
- English (Philippines)
- English (Nigeria)
- Deutsch
- Español (España)
- Español (México)
- Français
- Italiano
- Nederlands
- Português (Portugal)
- Polski
- Português (Brasil)
- Русский
- Türkçe
- العربية
- Ελληνικά
- Svenska
- Suomi
- עברית
- 日本語
- 한국어
- 简体中文
- 繁體中文
- Bahasa Indonesia
- Bahasa Melayu
- ไทย
- Tiếng Việt
- हिंदी
Reverse Divergence: European Strength, US Weakness
Published 06/04/2013, 07:47 AM
Updated 07/09/2023, 06:31 AM
Reverse Divergence: European Strength, US Weakness
Latest comments
Loading next article…
Install Our App
Risk Disclosure: Trading in financial instruments and/or cryptocurrencies involves high risks including the risk of losing some, or all, of your investment amount, and may not be suitable for all investors. Prices of cryptocurrencies are extremely volatile and may be affected by external factors such as financial, regulatory or political events. Trading on margin increases the financial risks.
Before deciding to trade in financial instrument or cryptocurrencies you should be fully informed of the risks and costs associated with trading the financial markets, carefully consider your investment objectives, level of experience, and risk appetite, and seek professional advice where needed.
Fusion Media would like to remind you that the data contained in this website is not necessarily real-time nor accurate. The data and prices on the website are not necessarily provided by any market or exchange, but may be provided by market makers, and so prices may not be accurate and may differ from the actual price at any given market, meaning prices are indicative and not appropriate for trading purposes. Fusion Media and any provider of the data contained in this website will not accept liability for any loss or damage as a result of your trading, or your reliance on the information contained within this website.
It is prohibited to use, store, reproduce, display, modify, transmit or distribute the data contained in this website without the explicit prior written permission of Fusion Media and/or the data provider. All intellectual property rights are reserved by the providers and/or the exchange providing the data contained in this website.
Fusion Media may be compensated by the advertisers that appear on the website, based on your interaction with the advertisements or advertisers.
© 2007-2024 - Fusion Media Limited. All Rights Reserved.