It was exactly one month ago we discussed our posture as a “bearish gold bull.”
The gold mining sector hit a historic low nearly 18 months ago but this new cycle has struggled to gain traction as metals prices have stagnated while the stock market and the US dollar have trended higher. Unfortunately recent technical and fundamental developments argue that precious metals could come under serious pressure in the weeks and months ahead.
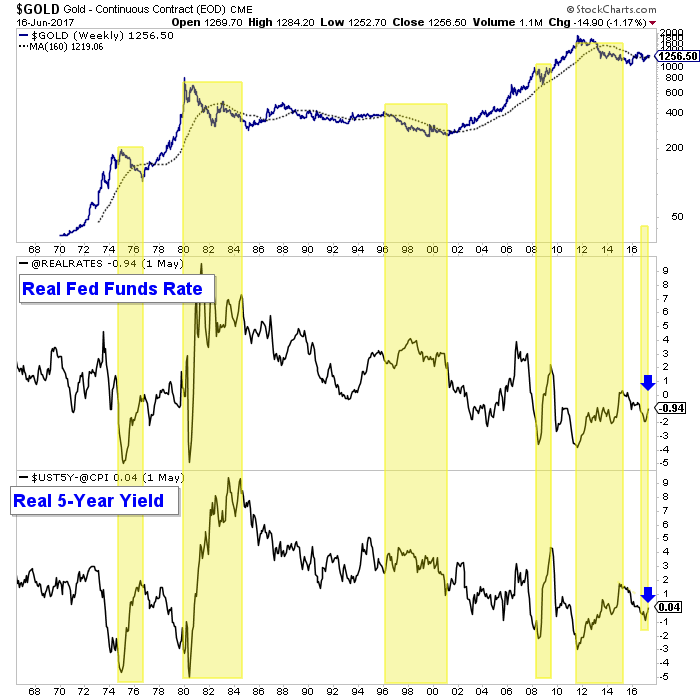
First let me start with gold’s fundamentals, which turned bearish a few months ago and could remain so through the fall. As we have argued, gold is inversely correlated to real interest rates. Gold rises when real rates fall and gold falls when real rates rise.
Real interest rates bottomed in February and have trended higher ever since. As we know, the rate of inflation has peaked and is declining. Meanwhile, the Fed funds rate has increased while bond yields have remained stable. The real Fed funds rate and the real 5-year yield have increased by 1% in recent months. If inflation falls by another 0.5% and the Fed funds rate is increased by another quarter point, then the real Fed funds rate would be positive by the end of the year. That would mark a 2% increase inside of 10 months.

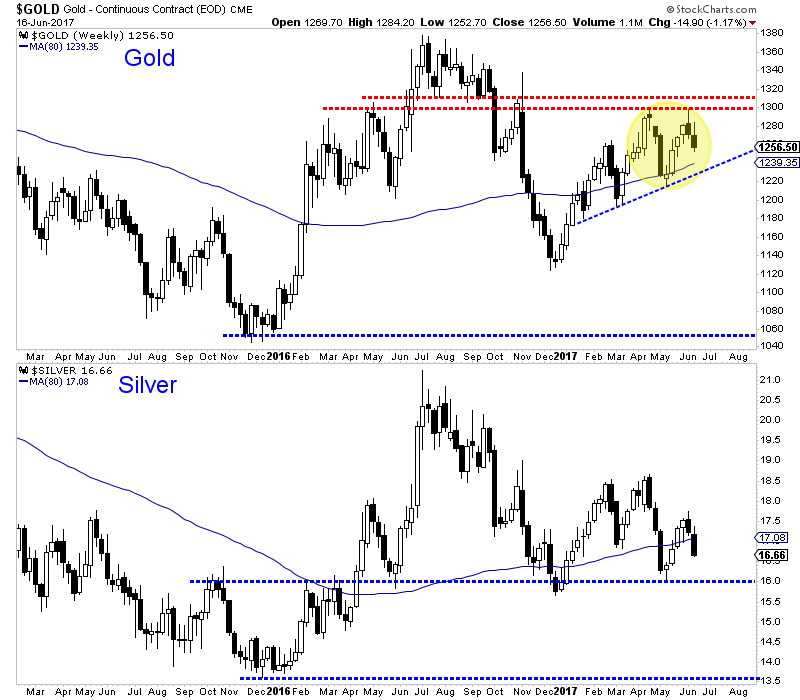
Turning to the technicals, we see that gold is starting to follow silver’s lead. Silver is very weak and headed for a test of $16/oz. Last week gold formed a bearish reversal at major resistance ($1300/oz) and closed the week in the red and even below its April high. If gold breaks its 2017 uptrend, then it is likely to retest the $1125/oz level. There will be rebounds along the way but both metals are at serious risk of retesting their bear market lows.

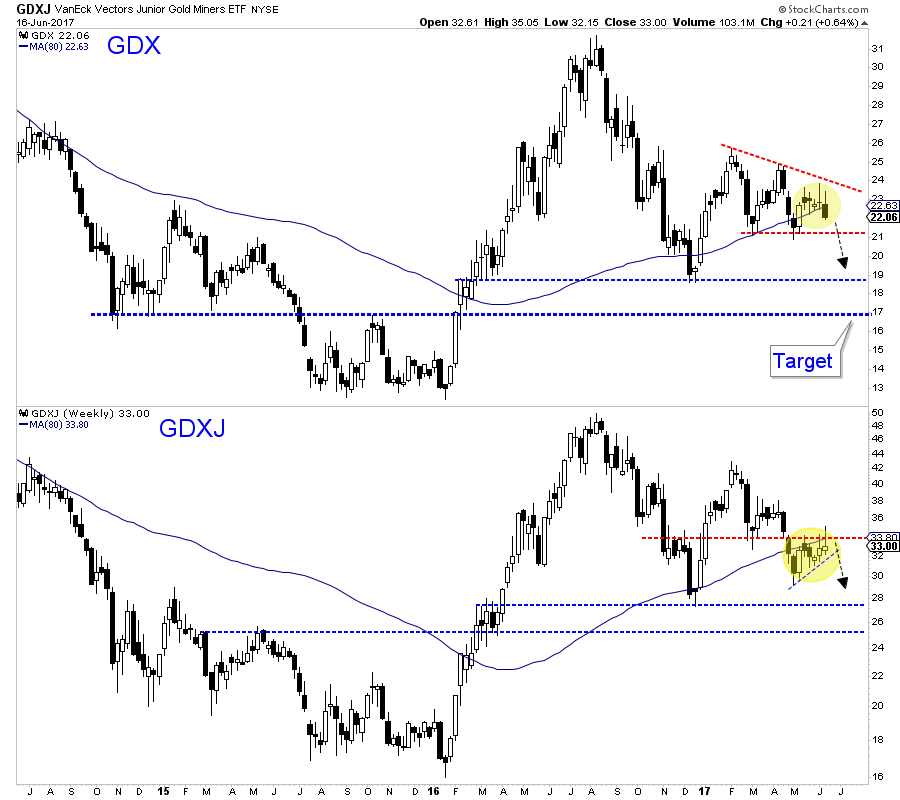
The miners, which have lagged the metals since February, could be close to a technical breakdown. Since February VanEck Vectors Gold Miners (NYSE:GDX) has consolidated within a descending triangle. The candlestick action of the past several weeks is favoring a break of support at $21. The measured downside target would be $17. Meanwhile, VanEck Vectors Junior Gold Miners (NYSE:GDXJ) has outperformed in recent weeks as the rebalancing has come and gone. It may continue to outperform but if the sector breaks lower it will not be spared.

Both the technicals and fundamentals argue there is increasing downside risk in the precious metals sector. Real interest rates are rising and as the rate of inflation continues to fall, gold will come under pressure even if nominal rates don’t rise.
From a bird’s eye view, the price action in gold and silver so far this year is corrective, meaning it is a correction of the sharp downtrend seen in the second half of 2016. There is a strong risk of that downtrend reasserting itself and metals ultimately retesting their bear market lows before the end of this year. With respect to the gold stocks, the initial downside target is the December 2016 lows which could be reached in the next month.
