Retail-Less
Despite all of the cheering by the mainstream media that the economy is “doing great” and “no recession” in sight, a look at small business sales trends and retail sales certainly suggest a very different story.
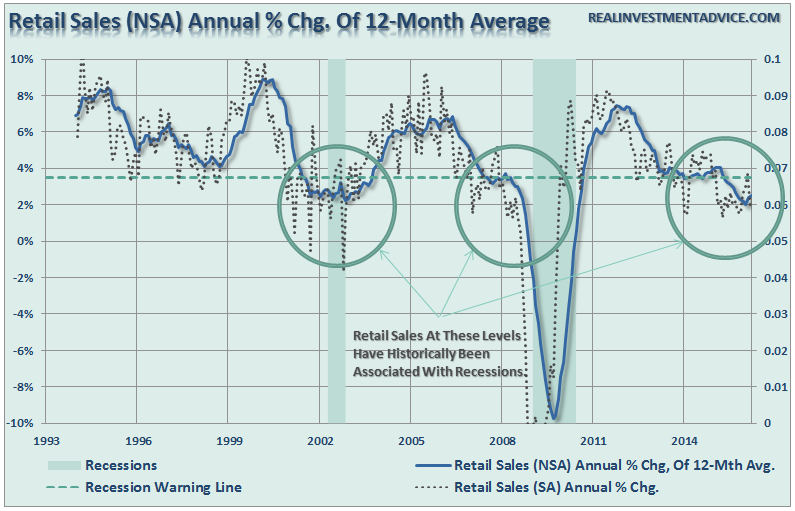
We recently saw the “retail sales figures” for March, which were, to say the least, disappointing. I say this because these numbers expose the flawed economic theories of the mainstream proletariat that the abnormally warm winter and exceptionally low energy prices should boost spending due to the relative savings.
Despite ongoing prognostications of a “recession nowhere in sight,” it should be remembered that consumption drives roughly 2/3rds of the economy. Of that, retail sales comprise about 40%. Therefore, the ongoing deterioration in retail sales should not be readily dismissed.
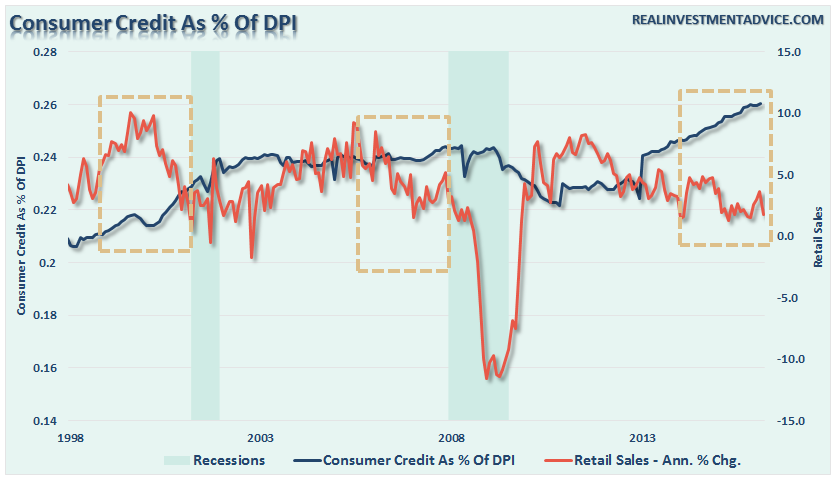
More troubling is the rise in consumer credit relative to the decline in retail sales as shown below.
What this suggests is that consumers are struggling just to maintain their current living standard and have resorted to credit to make ends meet. Since the amount of credit extended to any one individual is finite, it should not surprise anyone that such a surge in credit as retail sales decline has been a precursor to previous recessions.
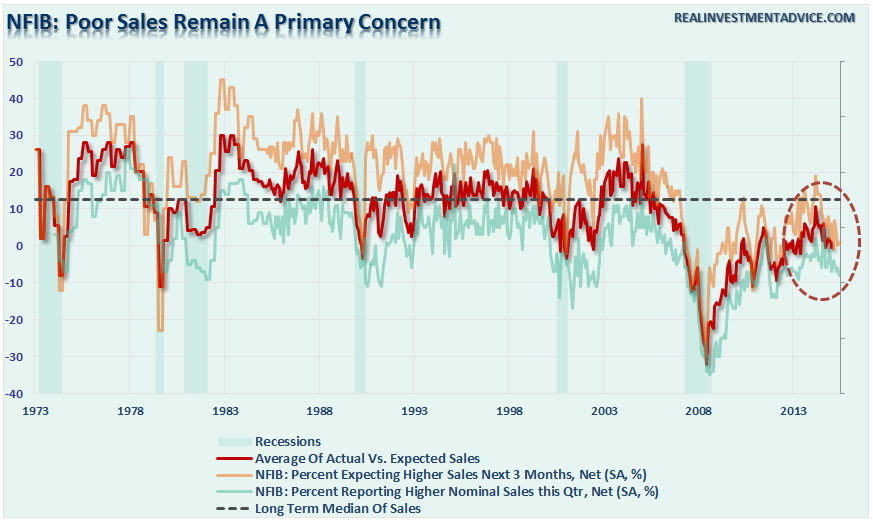
We can also see the problem with retail sales by looking at the National Federation of Independent Business Small Business Survey. The survey ask respondents about last quarter’s real sales versus next quarters expectations.
Not surprisingly, expectations are always much more optimistic than reality turns out to be. However, what is important is that both actual and expected retail sales are declining from levels that have historically been indicative of a recession.
Today, consumer credit has surged, without a relevant pickup in spending, to more than 26% of DPI. Given that it took a surge of $11 Trillion in credit to offset a decline in economic growth from 8% in the 70’s to an average of 4% during the 80’s and 90’s, it is unlikely that consumers can repeat that “hat trick” again.
A Different Valuation Measure
I recently discussed the effect of stock valuations on future long-term returns.
“I believe in long-term investing. I do think that you should buy quality investments and hold them long-term. However, what Wall Street, and many financial advisors miss, is the most important point of this argument which is ‘at the right valuation.’
Valuation, what you pay for an investment, is the single biggest determinant of future returns.
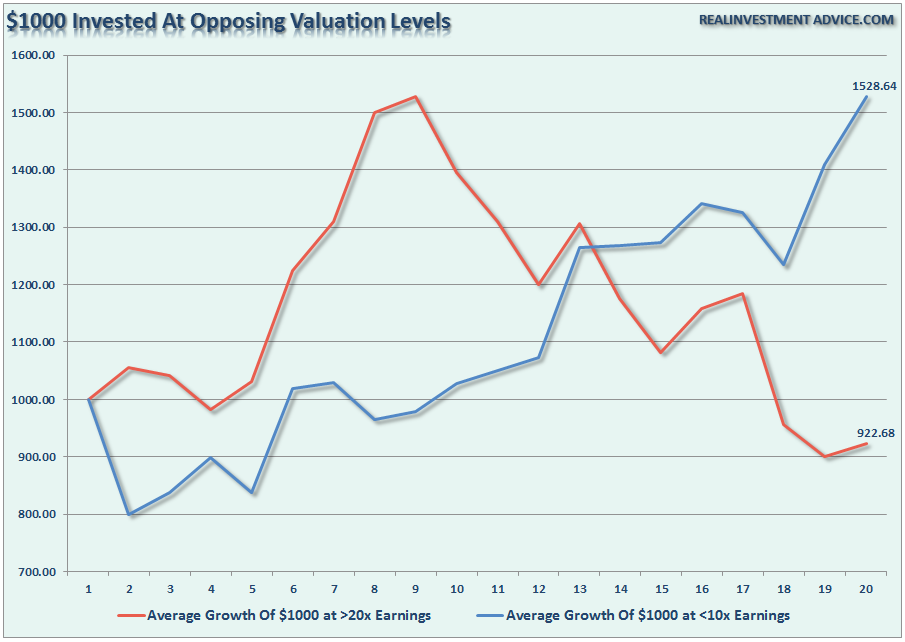
According to Dr. Roberts Shiller’s data, the Cyclically Adjusted P/E Ratio is currently hovering around 24x earnings. It is here that the problem for long-term investors currently resides. The chart below shows the average real (inflation-adjusted) 20-year returns of a $1000 investment made when P/E ratios first hit 20x or 10x earnings.”
As you can see, valuations make a huge difference.
However, not surprisingly, shortly after I published the article I received numerous emails citing low interest rates, accounting rule changes, and debt-funded buybacks all as reasons why “this time is different.” While such could possibly be true, it is worth noting that each of these supports are both artificial and finite in nature.
Currently, the aging U.S. economy, where productivity has exploded, wage growth has remained weak and whose households are weighed down by surging debt, remains mired in a slow-growth funk. This slow-growth funk has, in turn, put a powerful shareholder base to work increasing pressure on corporate managers not to invest, and to recycle capital into dividends and buybacks instead which has led to a record level of corporate debt.
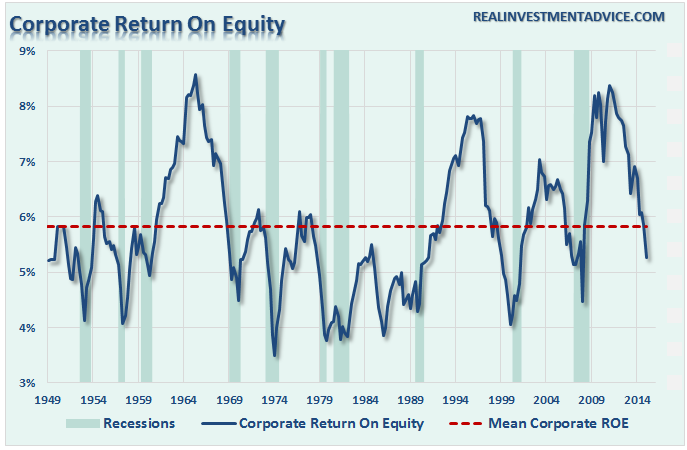
These actions, as suggested above, are limited in nature. For a while, these devices kept ROE elevated, however, the efficacy of those actions has now been reached.
Importantly, profit margins and ROE are reasonably well-correlated, which is what creates the perception that profit margins mean-revert. However, ROE is a better indicator of what is happening inside of corporate balance sheets more so than just profit margins. The current collapse in ROE is likely sending a much darker message about corporate health than profit margins currently.
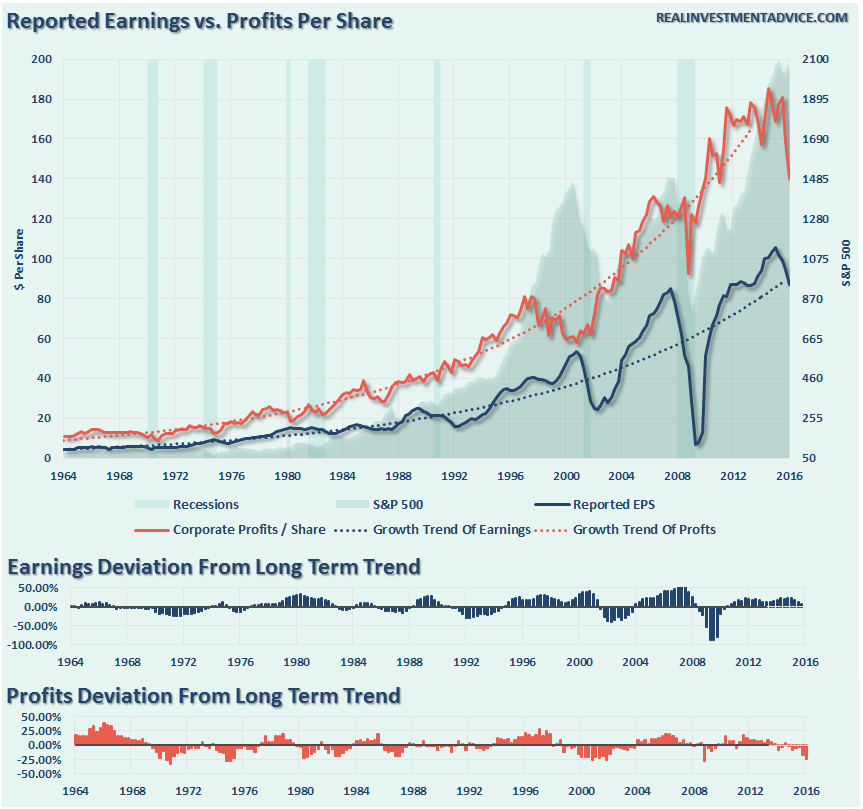
While the decline in reported earnings, which are subject to accounting manipulations and share buybacks have indeed declined, it is not nearly to the extent as shown by both ROE and Corporate Profits After Tax.
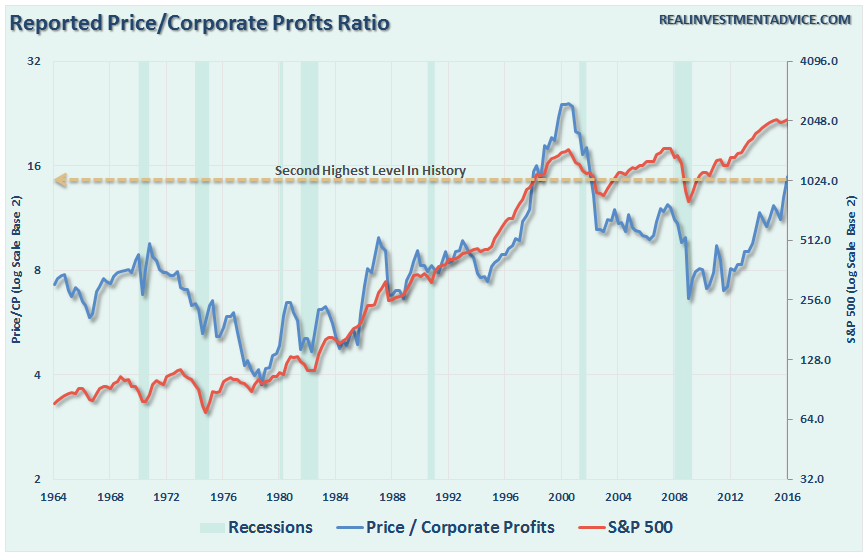
While traditional P/E ratios have surged to 24x earnings recently, Price to Corporate Profits Per Share (P/CP) has exploded to the second highest level on record.
Historically speaking, it is unlikely that with reported earnings early in the reversion process that we will see a sharp recovery in the second half of the year as currently expected by the majority of mainstream analysts. The suggests that as long as the Fed remains active in supporting asset prices, the deviation between fundamentals and fantasy will continue to stretch to extremes. The end result of which has never “been different this time.”
Did The Fed Kill The Bear?
Speaking of the Fed, the surge in the market over the last couple of days have many scratching their heads despite deteriorating economics, weak earnings and poor geopolitical news. Of course, given the series of emergency Fed meetings, the markets are currently beating on a much longer time frame to the next, if ever, rate hike.
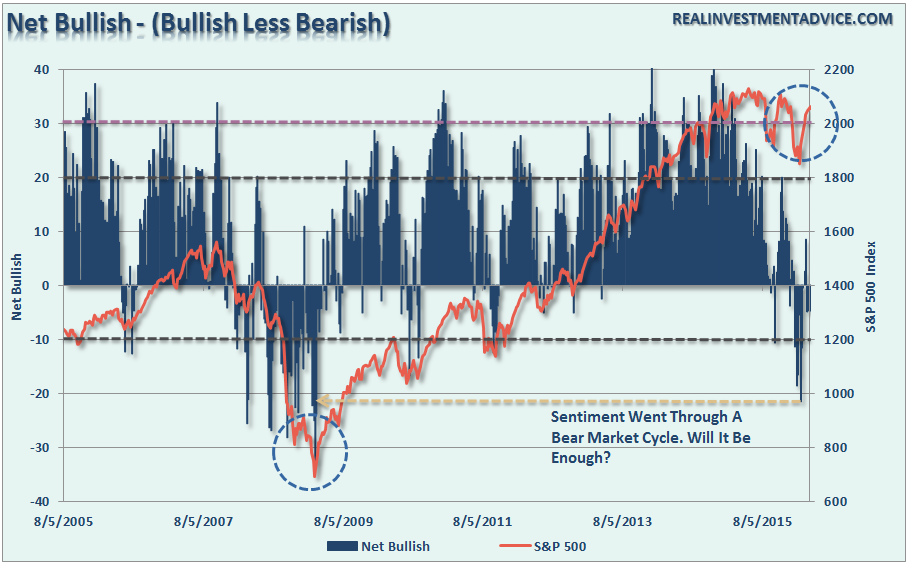
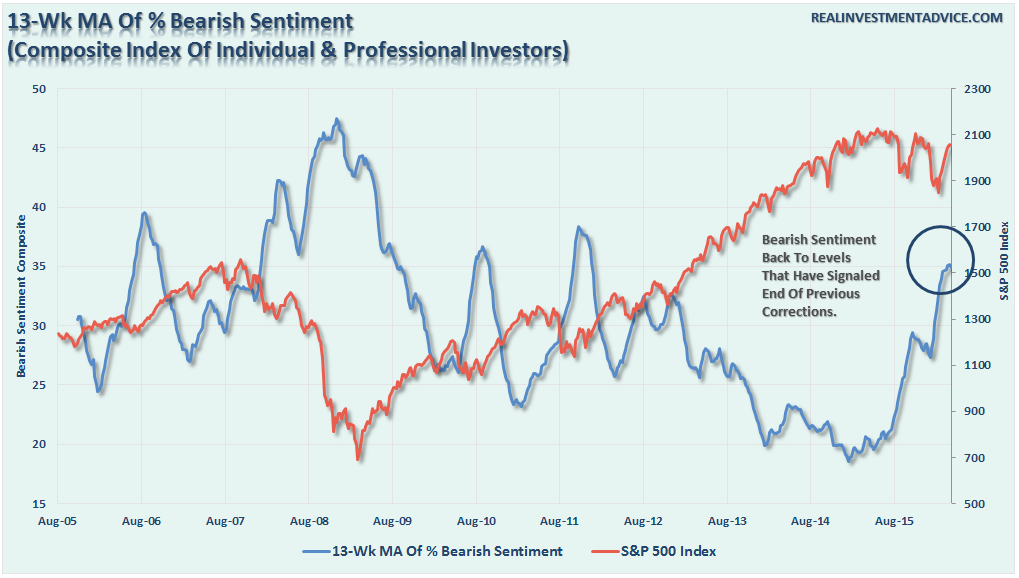
Of course, what is most interesting is what investor sentiment, both individual and professional, has recently accomplished.
Accordingly, the chart above, investor sentiment suggests the market has just completed a recessionary “bear market” with virtually no substantial losses. This can also be seen by looking at just the amount of “bearish” sentiment in the market as well.
As noted, the 13-week moving average of bearish sentiment has reached levels currently that are more normally associated with bottoms to corrective processes as seen in 2010 and 2011 when the Federal Reserve intervened with QE2 and Operation Twist. What is interesting is that all of the support during the current correction has been strictly “verbal” with no real change to market liquidity or accommodation.
“Make me promises, just tell me no lies.”
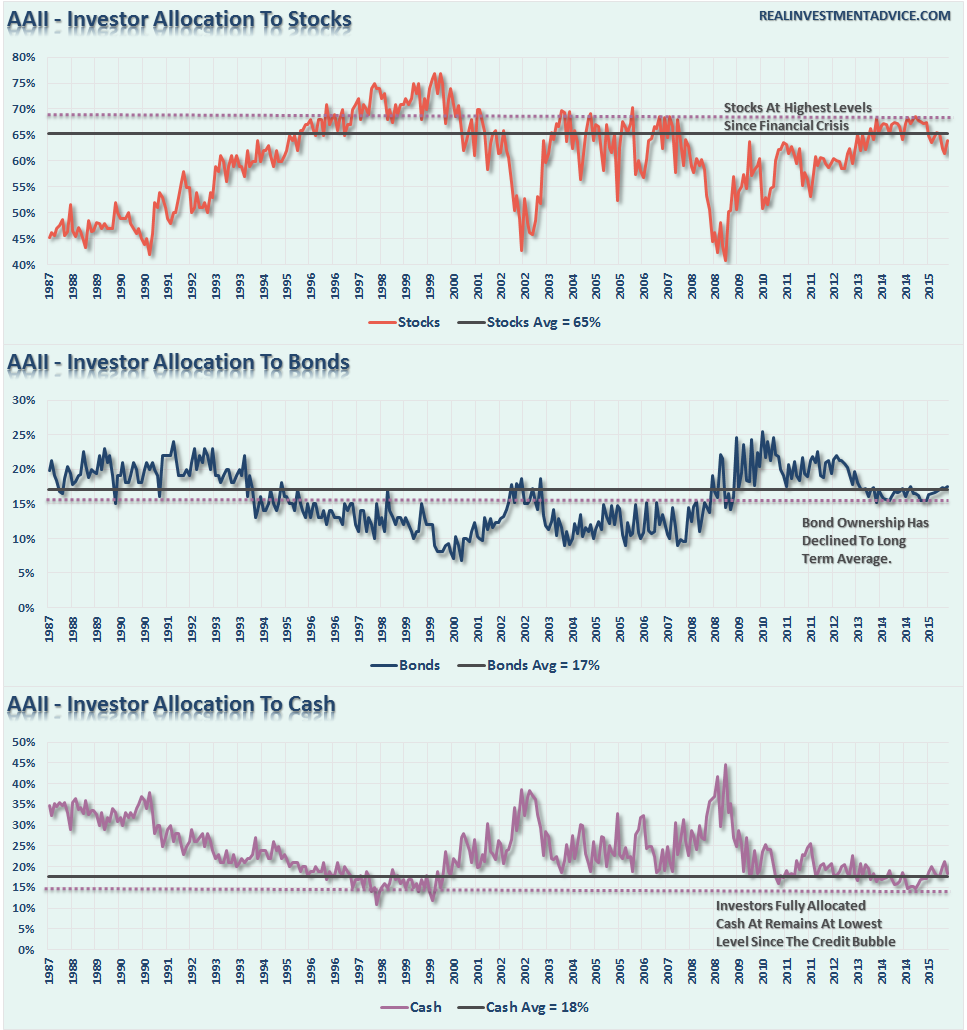
However, while this surge in bearish sentiment has occurred, which normally denotes a substantial level of fear by investors, there has been no substantial change to actual allocations.
While stock allocations have fallen modestly, cash and bond allocations have barely budged. This is a far different story than was seen during previous major and intermediate-term corrections in the market.
This suggests, is that while investors are worried about the markets and their investments, they are too afraid to actually make changes to their portfolio as long as Central Banks continue to bail out the markets.
What is clear is that the Federal Reserve has gained control of asset markets by gaining control over investor behavior.
“Are you afraid of a market crash? Yes. Are you doing anything about it? No.”
Again, it’s back to fundamentals versus expectations. Someone is going to be very wrong.

