Let’s face it, when it comes to the bullish/bearish argument about equities these days, the bears have virtually all of the arguments in their favor. However, I always think the bears hurt their case with poor arguments that tend to be repeated a lot – in fact, it’s one way to tell the perma-bears from the thoughtful bears.
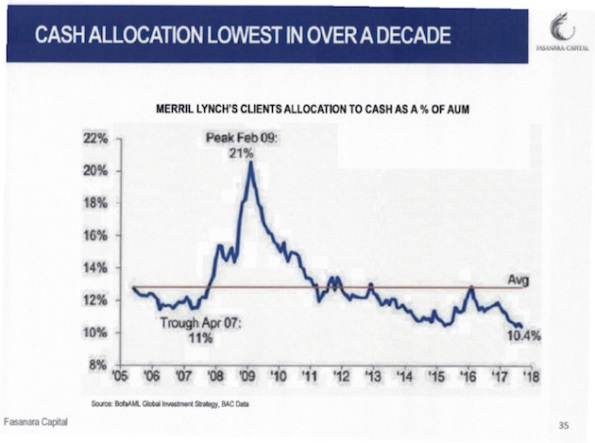
One of the arguments I have seen recently is that retail investors are way out over their skis and are very heavily invested in stocks with very low cash assets. This chart, which I saw in a recent piece by John Mauldin, is typical of the genre.
Now, bears are supposed to be the skeptics in the equation and there is not enough skepticism directed at the claim that retail investors are being overly aggressive. The first place a person could start is with asking “shouldn’t allocations properly be lower now, with zero returns to cash, than they were when yields were higher?”
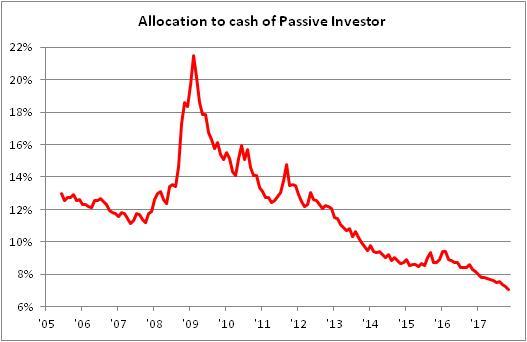
But as it turns out, we don’t even have to ask that question because there’s a simpler one that makes this argument evaporate. Consider an investor who, instead of actively allocating to stocks when they’re “hot” (stupid retail investor! Always long at the top!) and away from them when they’re “cold” (dummy! That’s when you should be loading up!), is passive. He/she begins in mid-2005 (when the chart above begins) with a 13% cash allocation and the balance of 87% allocated to stocks. Thereafter, the investor goes to sleep for twelve years. The cash investments gain slowly according to the 3-month T-Bill rate; the equity investments fluctuate according to the change in the Wilshire 5000 Total Market index. This investor’s cash allocation ends up looking like this.
It turns out that since the allocation to cash is, mathematically, CASH/(CASH+STOCKS), when the denominator declines due to stock market declines the overall cash ratio moves automatically. Thus, it seems that maybe what we’re looking at in the “scary” chart is the natural implication of fluctuating markets and uninvolved as opposed to return-chasing investors.
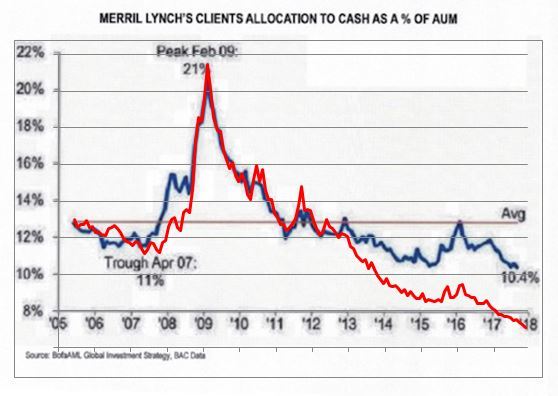
It gets better than that. I put the second chart on top of the first chart, so that the axes correspond.
Retail investors are actually much more in cash than a passive investor would be. In other words, instead of being the return chasers, it turns out that retail investors seem to have been responding to higher prices by raising cash, doing what attentive investors should do: rebalancing. So much for this bearish argument (to be clear, I think the bears are correct – it’s just that this argument is lame).
Isn’t math fun?


