The last quarter of the year is the strongest period for retail sales – all due to holiday gift giving.
Reading the retail sales headlines – November’s seasonally adjusted retails sales were up 0.7% over October. This seems some pretty strong evidence that holiday purchasing is growing.
Total Seasonally Adjusted Retail Sales – Dollar Volume (blue line, left axis), Month-to-Month Change (red line, right axis)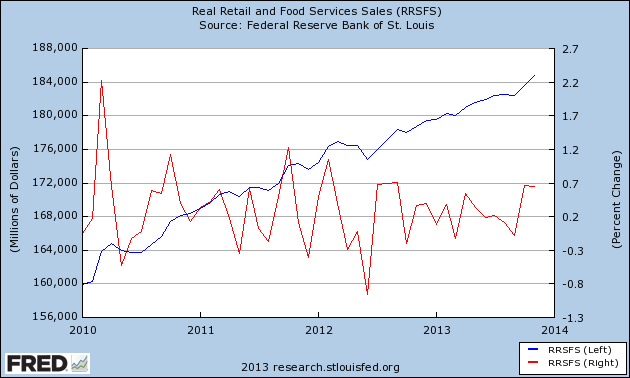
Could this growth be a distortion caused by US Census in their seasonal adjustment process? The unadjusted numbers say things are a little weaker this year.
The thick purple line in the middle of the graph below is the unadjusted year-over-year growth in retail sales. Note that the rate of growth was lower in November 2013 than it was in November 2012.
Unadjusted Year-over-Year Growth – Non-store Retailers (blue line), General Merchandise Stores (red line), Autos (green line), Department Stores (orange line), and Total Retail Trade (purple line)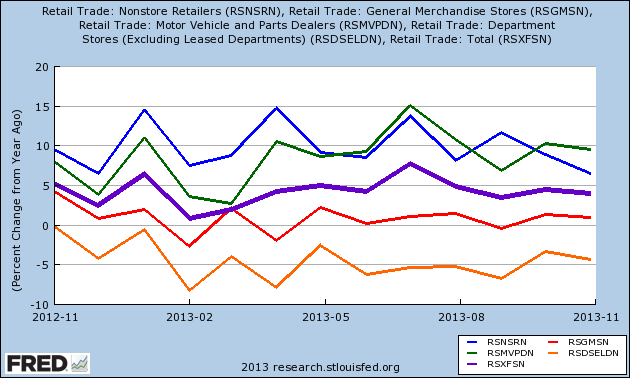
No question retail is growing – but likely not growing at the same rate as last year. The major exceptions are autos (green line) whose rate of growth is up, and department stores whose rate of growth has contracted almost 5% from last year.
Do I trust this data? I trust nothing that is called “advance” from any government reporting agency. It could be too high, too low – but hardly ever just right. The only confidence level I can assign to this is that the unadjusted growth plots out within the expected range. It could be that the computer program fills in the data using the current trend lines when the data is not available. This is how advance data (and the jobs report which is released too far in advance of reasonably accurate data) miss economic turning points.
As I am complaining – you will note that I did not use the word Christmas in describing the Christian gift giving rituals responsible for the “holiday season” retail sales increase. I don’t think the founding fathers are smiling at the new interpretation of separation of church and state. Christmas is religious and therefore bad, holidays are good. Without Christmas, there is no retail cheer.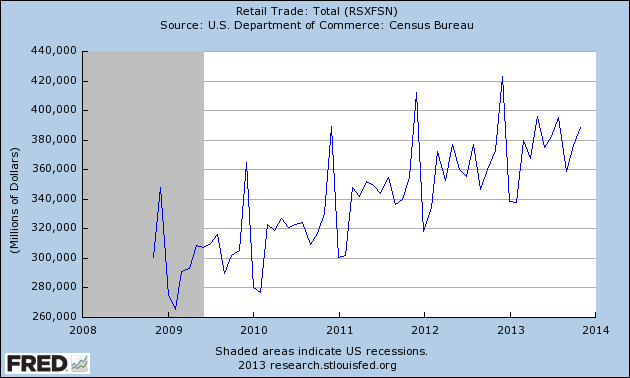
The retail sales spikes in the above chart are caused by CHRISTMAS – repeating that this is a CHRISTIAN ritual and not a “holiday” created by the USA government.
Color me too old to put up with this nonsense. Merry Christmas.
Other Economic News this Week:
The Econintersect economic forecast for December 2013 again improved. What this forecast cannot see is the real effect of austerity and Obamacare – but it does see that business is betting the effects on the economy will be minimal.
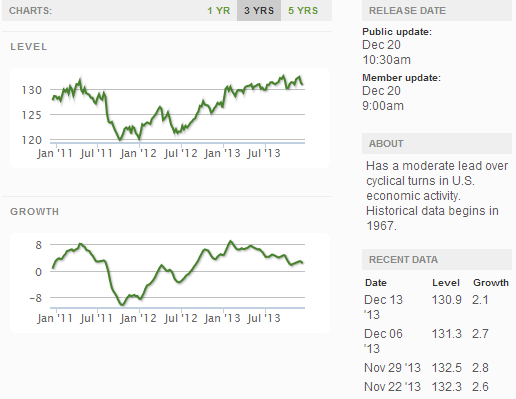
The ECRI WLI growth index value has been weakly in positive territory for over four months – but in a noticeable improvement trend. The index is indicating the economy six month from today will be slightly better than it is today.
Current ECRI WLI Growth Index:
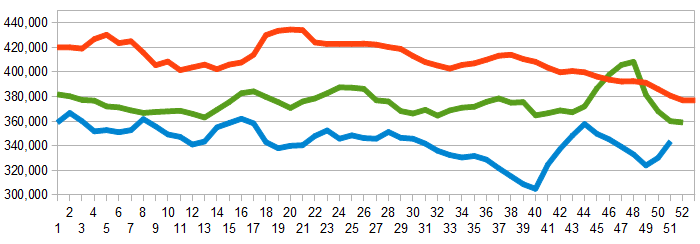
Initial unemployment claims went from 368,000 (reported last week) to 379,000 this week. Historically, claims exceeding 400,000 per week usually occur when employment gains are less than the workforce growth, resulting in an increasing unemployment rate. The real gauge – the 4 week moving average – degraded from 328.750 (reported last week) to 343,500. Because of the noise (week-to-week movements from abnormal events AND the backward revisions to previous weeks releases), the 4-week average remains the reliable gauge.
Weekly Initial Unemployment Claims – 4 Week Average – Seasonally Adjusted – 2011 (red line), 2012 (green line), 2013 (blue line)
Bankruptcies this Week: Privately-held Constar International Holdings
Weekly Economic Release Scorecard:
Click here to view the scorecard table below with active hyperlinks
- English (UK)
- English (India)
- English (Canada)
- English (Australia)
- English (South Africa)
- English (Philippines)
- English (Nigeria)
- Deutsch
- Español (España)
- Español (México)
- Français
- Italiano
- Nederlands
- Português (Portugal)
- Polski
- Português (Brasil)
- Русский
- Türkçe
- العربية
- Ελληνικά
- Svenska
- Suomi
- עברית
- 日本語
- 한국어
- 简体中文
- 繁體中文
- Bahasa Indonesia
- Bahasa Melayu
- ไทย
- Tiếng Việt
- हिंदी
Retail Cheer, Thanks To Christmas
Published 12/22/2013, 04:59 AM
Retail Cheer, Thanks To Christmas
Latest comments
Loading next article…
Install Our App
Risk Disclosure: Trading in financial instruments and/or cryptocurrencies involves high risks including the risk of losing some, or all, of your investment amount, and may not be suitable for all investors. Prices of cryptocurrencies are extremely volatile and may be affected by external factors such as financial, regulatory or political events. Trading on margin increases the financial risks.
Before deciding to trade in financial instrument or cryptocurrencies you should be fully informed of the risks and costs associated with trading the financial markets, carefully consider your investment objectives, level of experience, and risk appetite, and seek professional advice where needed.
Fusion Media would like to remind you that the data contained in this website is not necessarily real-time nor accurate. The data and prices on the website are not necessarily provided by any market or exchange, but may be provided by market makers, and so prices may not be accurate and may differ from the actual price at any given market, meaning prices are indicative and not appropriate for trading purposes. Fusion Media and any provider of the data contained in this website will not accept liability for any loss or damage as a result of your trading, or your reliance on the information contained within this website.
It is prohibited to use, store, reproduce, display, modify, transmit or distribute the data contained in this website without the explicit prior written permission of Fusion Media and/or the data provider. All intellectual property rights are reserved by the providers and/or the exchange providing the data contained in this website.
Fusion Media may be compensated by the advertisers that appear on the website, based on your interaction with the advertisements or advertisers.
© 2007-2025 - Fusion Media Limited. All Rights Reserved.

