
Gold
The yellow metal was eventually unchanged on the week, after making moves in both directions, as the market struggled to gain conviction. With USD having traded mildly stronger throughout this week’s trade, gold was found to be held up by safe haven inflow linked to slumping equity prices. The S&P turned lower once again this week as US rate hikes have come back into focus.
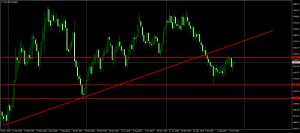
Gold prices remain penned in below the 1235.30 resistance level which has now capped price action for three consecutive weeks. For now, there is still the chance of a break higher which would bring the broken bullish trend line from 2015 lows back into focus. To the downside, the 2018 lows at 1158.84 are the first key level to watch with the late 2016 lows of 1122.81 the next level to focus on.
Silver prices broke their correlation with gold this week and traded lower. Despite its links with gold, silver often trades in tandem with equities prices, primarily the industrials, due to its use as an industrial metal. With concerns regarding ongoing trade wars and the risks from Brexit, risk sentiment has turned lower once again weighing on equity prices which in turn has seen silver trading lower.
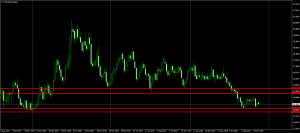
Silver prices pierced below the 13.6704 – 13.9612 level support this week to print fresh 2018 lows before recovering back above the level and forming a potential double bottom. However, unless the price makes it back above the 15.1825 – 15.5734 level, the focus will be on the further downside.
The red metal was lower over the week reflecting the market’s disappointment with the ongoing tensions between the US and China. The US has made fresh accusations against China which it claims is perpetuating unfair trade practices. China has responded in a less defensive manner than usual, simply urging the US to stop provoking it. This latest dispute comes just days ahead of the highly anticipated meeting between China and the US to be held at the G20 summit in Argentina.
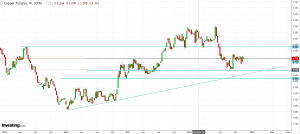
For now, copper prices continue to battle it out around the 2.767 level which has seen volatile but evenly matched order flow. To the downside, we have support at the 2.567 level (2018 low) with the rising trend line from 2016 lows coming in around the same level also and a deeper 2.443 structural level below that. To the topside, the 2.959 level is the main resistance to watch (broken 2015, the range of swing lows over late 2017 / early 2018).
Iron ore prices cratered lower this week. After the months-long we’ve seen recently, iron ore this week experienced its largest percentage drop since June as trade war concerns and rising US interest rates came back into sharper focus. The primary source of the decline in iron ore prices, however, was the news that iron ore shipments from Australia, which had been lower recently due to supply disruptions, rebounded last week. Shipments from Port Hedlund rose from 14.3 million tonnes over the prior week to 16.4 million last week. The decline in iron ore also comes despite firmer prices in Chinese steel markets which have been boosted by temporary output restrictions in Hebei, China’s central steel-making region.
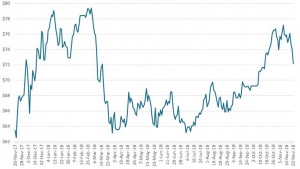
After rallying as high as $77 last month, iron ore prices have since dropped back down as low as $72. There is no real structural support in the area until we retest the breakout base of around $70 so while the fundamental backdrop remains heavy, lower prices are to be expected. To the topside, any retest of the $74 level will likely see resistance.