
Restaurant Brands International, Inc. (NYSE:QSR) reported mixed fourth quarter of 2017 results, with earnings surpassing the Zacks Consensus Estimate but revenues missing the same.
Adjusted earnings of 66 cents per share outpaced the Zacks Consensus Estimate of 57 cents by 15.8%. The bottom line also improved 50% year over year on higher revenues, partly offset by increased expenses.
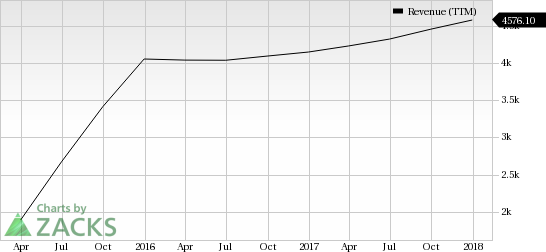
Revenues of $1.2 billion increased 11.1% year over year primarily owing to the inclusion of Popeye’s Louisiana Kitchen’s results as well as higher system-wide sales at both the Tim Hortons and the Burger King segments. However, the top line missed the consensus mark of $1.3 billion by 2%.
Concurrent with the release of quarterly results, Restaurant Brands declared a dividend of 45 cents per share payable on April 2, 2018 to shareholders and unitholders of record at the close of business on March 15, 2018.
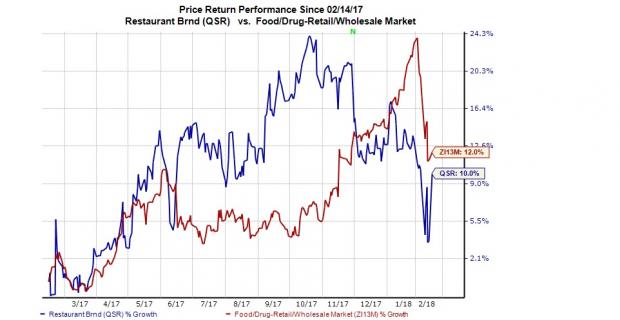
In a year’s time, the stock has gained 10% compared with the industry’s 12% rally.
Let’s delve deeper in to the numbers.
Segmental Performance
Restaurant Brands operates through three segments – Tim Hortons, Burger King and Popeye’s Louisiana Kitchen.
Tim Hortons reported revenues of $821.7 million, reflecting a rise of 3.5% (decline of 0.9% on an FX neutral basis) over the prior-year quarter, primarily owing to system-wide sales growth.
System-wide sales increased 2.4% on the back of net restaurant growth. The improvement in sales remained unchanged from the year-ago period but the metric was lower than 3% posted last quarter.
Comps at this segment increased 0.1% in the quarter versus 0.2% growth in the prior-year quarter and 0.3% increase in the preceding quarter. Comps were primarily driven by 0.8% growth in Canada.
Burger King’s revenues were up 8.6% from the prior-year quarter to $344.9 million, mainly on the back of system-wide sales growth.
System-wide sales rose 12.3%, higher than 8.5% growth in the year-ago comparable period and 11.2% increase in the preceding quarter. System-wide sales growth can be attributable to net restaurant growth of 6.5% and positive comps growth.
Comps grew 4.6% in the quarter under review versus 2.8% growth in the prior-year quarter and 3.6% increase in the preceding quarter. The upside was driven by U.S. comps growth of 5.1%.
Popeye’s Louisiana Kitchen revenues in this segment amounted to $67.6 million. System-wide sales rose 6.8% owing to net restaurant growth of 6.1%, partially offset by declining comps. Notably, comps at this division declined 1.3% comparing unfavorably with a 2.8% decline in the year ago quarter and 1.8% in the prior quarter. The decline was due to a 2.5% decrease in U.S. comps.
Restaurant Brands International Inc. Revenue (TTM)
Operating Performance
Company adjusted EBITDA rose 13.7% (10.8% FX neutral) owing to revenue increase and cost management. Segment wise, Tim Hortons EBITDA grew 9.2% (4.7% on an FX neutral basis) year over year driven mainly by revenue growth, and decline in segment selling, general and administrative expenses (SG&A). Burger King’s EBITDA was up 13.4% (12.1% on an FX neutral basis) year over year driven primarily by revenue growth and cost control.
Cash, Capital and Dividend
The company exited the quarter with cash and cash equivalent balance of $1.2 billion, accounts receivable balance of $455.9 million and inventories of $78 million. Long-term debt was $11.8 billion. In 2017, net cash provided by operating activities was $1.4 billion.
During the quarter under review, the company completed preferred share redemption and repurchase of 5 million partnership exchangeable units of Restaurant Brands International Limited Partnership.
Zacks Rank and Key Picks
Restaurant Brands carries a Zacks Rank #3 (Hold).
Better-ranked stocks in the same space are Darden Restaurants (NYSE:DRI) , BJ's Restaurants (NASDAQ:BJRI) and Brinker International (NYSE:EAT) , each carrying a Zacks Rank #2 (Buy). You can see the complete list of today’s Zacks #1 Rank (Strong Buy) stocks here.
Long-term earnings growth rate for Darden, BJ's Restaurants and Brinker is projected to be 10.9%, 15.3% and 13.5%, respectively.
The Hottest Tech Mega-Trend of All
Last year, it generated $8 billion in global revenues. By 2020, it's predicted to blast through the roof to $47 billion. Famed investor Mark Cuban says it will produce "the world's first trillionaires," but that should still leave plenty of money for regular investors who make the right trades early.
See Zacks' 3 Best Stocks to Play This Trend >>
BJ's Restaurants, Inc. (BJRI): Free Stock Analysis Report
Darden Restaurants, Inc. (DRI): Free Stock Analysis Report
Restaurant Brands International Inc. (QSR): Free Stock Analysis Report
Brinker International, Inc. (EAT): Free Stock Analysis Report
Original post
Zacks Investment Research