
Restaurant Brands International, Inc. (NYSE:QSR) reported better-than-expected results in the fourth-quarter 2018, after missing the estimates in the preceding quarter. Both the top and bottom line also increased on a year-over-year basis. Following the quarterly results, shares of the company increased 1.6%. Also, the stock has surged 15.4% in the past three months, outperforming the industry’s collective growth of 1.3%.
Adjusted earnings of 68 cents per share surpassed the Zacks Consensus Estimate by a penny and increased 3% from the year-ago quarter number. This uptick can be primarily attributable to a consistent improvement in the company’s top line.
Total revenues came in at $1,385 million, which outpaced the consensus estimate of $1,378 million. The metric also improved 12.2% from the year-ago quarter figure, courtesy of increased system-wide sales across the company’s brands.
Segmental Revenues
Restaurant Brands operates through three segments — Tim Hortons, Burger King and Popeye’s Louisiana Kitchen.
Revenues at Tim Hortons totaled $852 million compared with $822 million in the prior-year quarter. Rise in franchise and property revenues led to revenue growth. Also, system-wide sales increased 2.4% on the back of net restaurant growth. Comps at this segment grew 1.9% compared with 0.1% gain in the prior-year quarter and 0.6% growth reported in the last reported quarter.
Burger King’s revenues increased from $345 million in fourth-quarter 2017 to $427 million in the quarter under review, mainly driven by increased franchise and property revenues. Meanwhile, system-wide sales rose 8.4%, narrower than 12.3% growth registered in the year-ago comparable period and a 7.8% increase in the last reported quarter. System-wide sales growth can be attributed to net restaurant growth of 6.1% and positive comps growth.
Comps grew 1.7% in the quarter under review compared with 4.6% growth in the prior-year quarter and a 1% increase in the last reported quarter.
Restaurant Brands International Inc. Price, Consensus and EPS Surprise
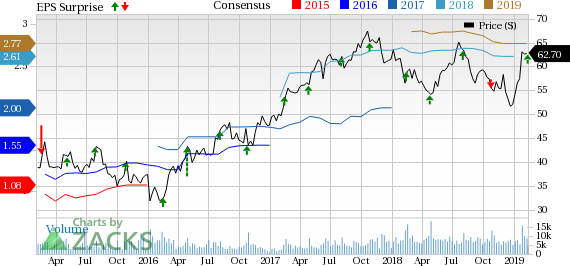
Restaurant Brands International Inc. Price, Consensus and EPS Surprise | Restaurant Brands International Inc. Quote
Popeye’s Louisiana Kitchen, which was acquired on Mar 27, 2017, reported revenues of $106 million compared with $67 million in the year-ago quarter.
Also, system-wide sales rose 6.3% owing to net restaurant growth of 6.8% and comps growth of 0.1%. Notably, system-wide sales growth compared favorably with prior-year quarter’s 6.8% increase. Moreover, comparable sales compared favorably with the prior-year quarter’s comps decline of 1.3%.
Operating Performance
Per the Previous Accounting Standard, the company’s adjusted EBITDA rose 2.6% on an organic basis driven by system-wide sales growth. Segment-wise, Tim Horton’s EBITDA was up 0.6%, organically. On an organic basis, Burger King’s EBITDA grew 3.3% year over year. Popeye’s EBITDA was up 13.3%, organically.
Cash and Capital
Restaurant Brands exited the fourth quarter with cash and cash equivalent balance of $913 million, under the new accounting standard. As of Dec 31, 2018, total debt was $12.3 billion. The company’s board of directors declared a dividend of 50 cents per share for the first quarter of 2019, up 11.1% from the prior-year quarter dividend, payable Apr 3 to its shareholders of record at the close of business as of Mar 15.
Zacks Rank & Key Picks
Restaurant Brands has a Zacks Rank #3 (Hold). Better-ranked stocks in the same space include Brinker International, Inc. (NYSE:EAT) , El Pollo Loco Holdings, Inc. (NASDAQ:LOCO) and Darden Restaurants, Inc. (NYSE:DRI) , each carrying a Zacks Rank #2 (Buy). You can see the complete list of today’s Zacks #1 Rank (Strong Buy) stocks here.
Brinker International has an impressive long-term earnings growth rate of 14.5%.
El Pollo Loco Holdings delivered positive earnings surprise in three out of the trailing four quarters, the average beat being of 5.5%.
Darden Restaurants reported better-than-expected earnings in three out of the trailing four quarters, the average beat being 4%.
Zacks' Best Stock-Picking Strategy
It's hard to believe, even for us at Zacks. But from 2000-2018, while the market gained +4.8% per year, our top stock-picking strategy averaged +54.3% per year.
How has that screen done lately? From 2017-2018, it sextupled the market's +15.8% gain with a soaring +98.3% return.
Free – See the Stocks It Turned Up for Today >>
Brinker International, Inc. (EAT): Get Free Report
El Pollo Loco Holdings, Inc. (LOCO): Get Free Report
Darden Restaurants, Inc. (DRI): Get Free Report
Restaurant Brands International Inc. (QSR): Get Free Report
Original post
Zacks Investment Research