There seems to be some respite for Bitcoin traders. It might be tempting to take this breather as a sign of the tide turning. We highlight the reasons why you probably shouldn’t.
In the last couple of days, Bitcoin has gone up a bit. This has brought questions about whether the current move is only a correction within a decline or already an important sign of a shift in the market. In an article on CoinDesk, we read:
Bitcoin looks primed for a move to $8,000, but low trading volumes point to the risk of a bull trap.
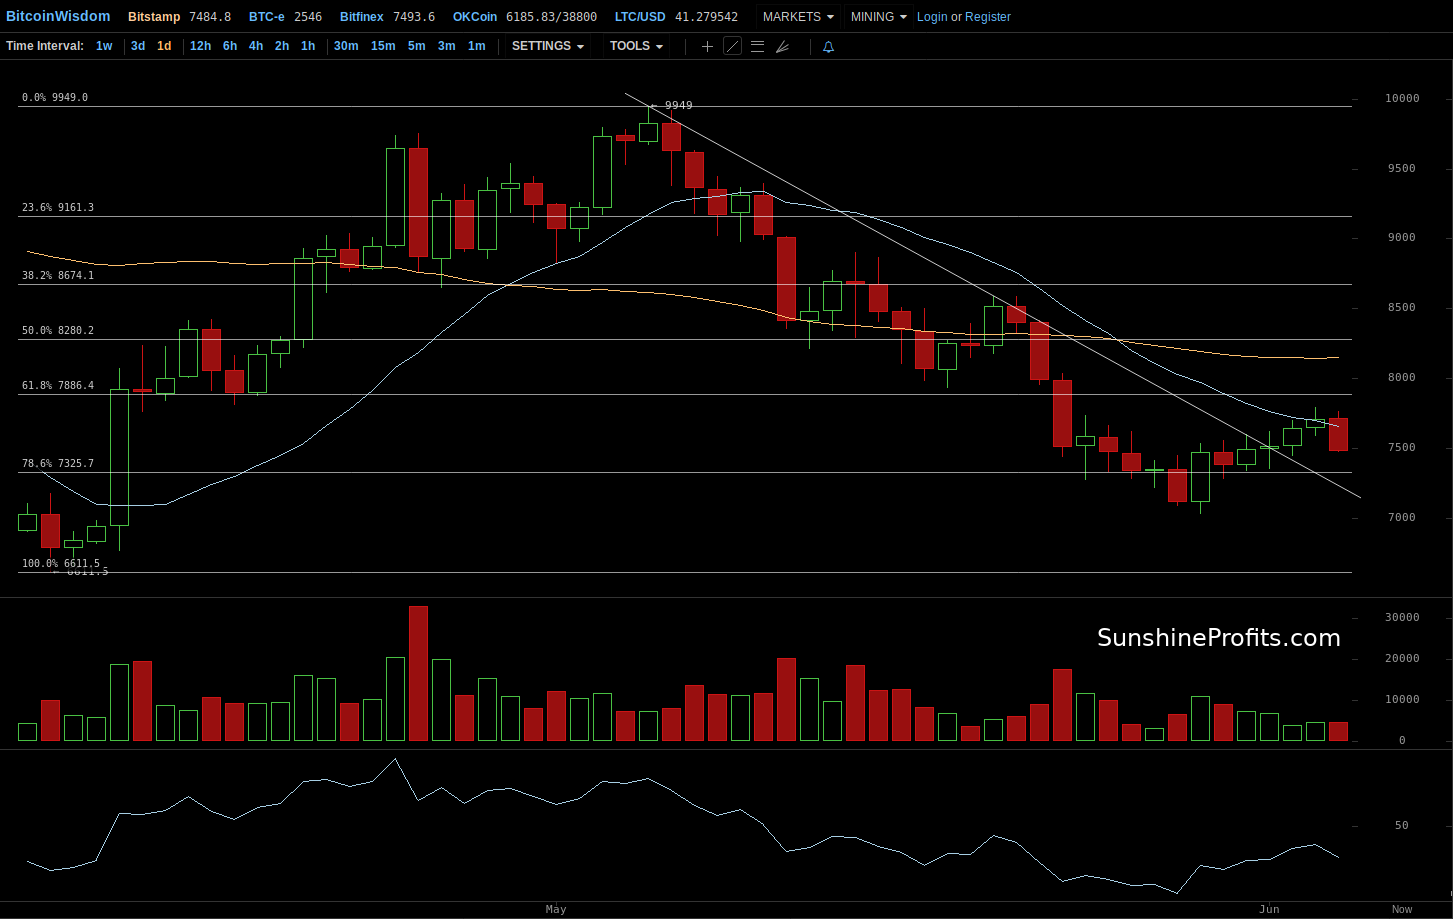
The cryptocurrency broke through a key descending trendline (drawn through the May 6 high to the May 21 high) on Sunday, adding credence to last Tuesday's bullish outside-day candle and signaling a short-term bearish-to-bullish trend change.
However, at the same time, daily trading volume fell 1.77 percent to $4.85 billion, according to CoinMarketCap. Further, rolling 24-hour trading volume currently stands at $4.95 billion – down 22.5 percent from the current quarterly average of $6.38 billion.
Low volume is a cause for concern for the bulls, as it is widely considered a sign that the market is approaching a peak; that is, the rally will be short-lived.
We have a slightly different take on whether Bitcoin is set to move above $8,000 – the currency might shoot up above this level but we haven’t really seen enough signs that this is the case just yet. Other than than, we generally support the conclusions of the cited couple of paragraphs.
Bitcoin is up and it went above the declining resistance line but this line might have just turned out to stop the appreciation. The declining volume seems to be a classic bearish indication. And we might see a daily close below this line today, which would be bearish as well. We still think that a move up can’t be ruled out but the move down we’ve seen today weakens the recent bullish signs.
Any Important Bullish Implications?

On BitStamp, we see the recent move up and the depreciation of today. The appreciation of the last couple of days brought Bitcoin above the 78.6% Fibonacci retracement level and this is a slightly bullish indication. Only slightly, because this particular level is not an extremely important one.
A more bullish indication is the breakout above the declining resistance line based on recent tops. This indicates that the move up might be stronger than the preceding ones but the fact that Bitcoin turned South today, and is now closer to this level, weakens the bullish implications slightly.
Have we seen very important bullish indications, though? Not really. Bitcoin is still below the 61.8% Fibonacci retracement level and the action hasn’t really changed the short-term outlook. And this is only for the short term, without really considering the bigger picture into account.
Verification in Disguise

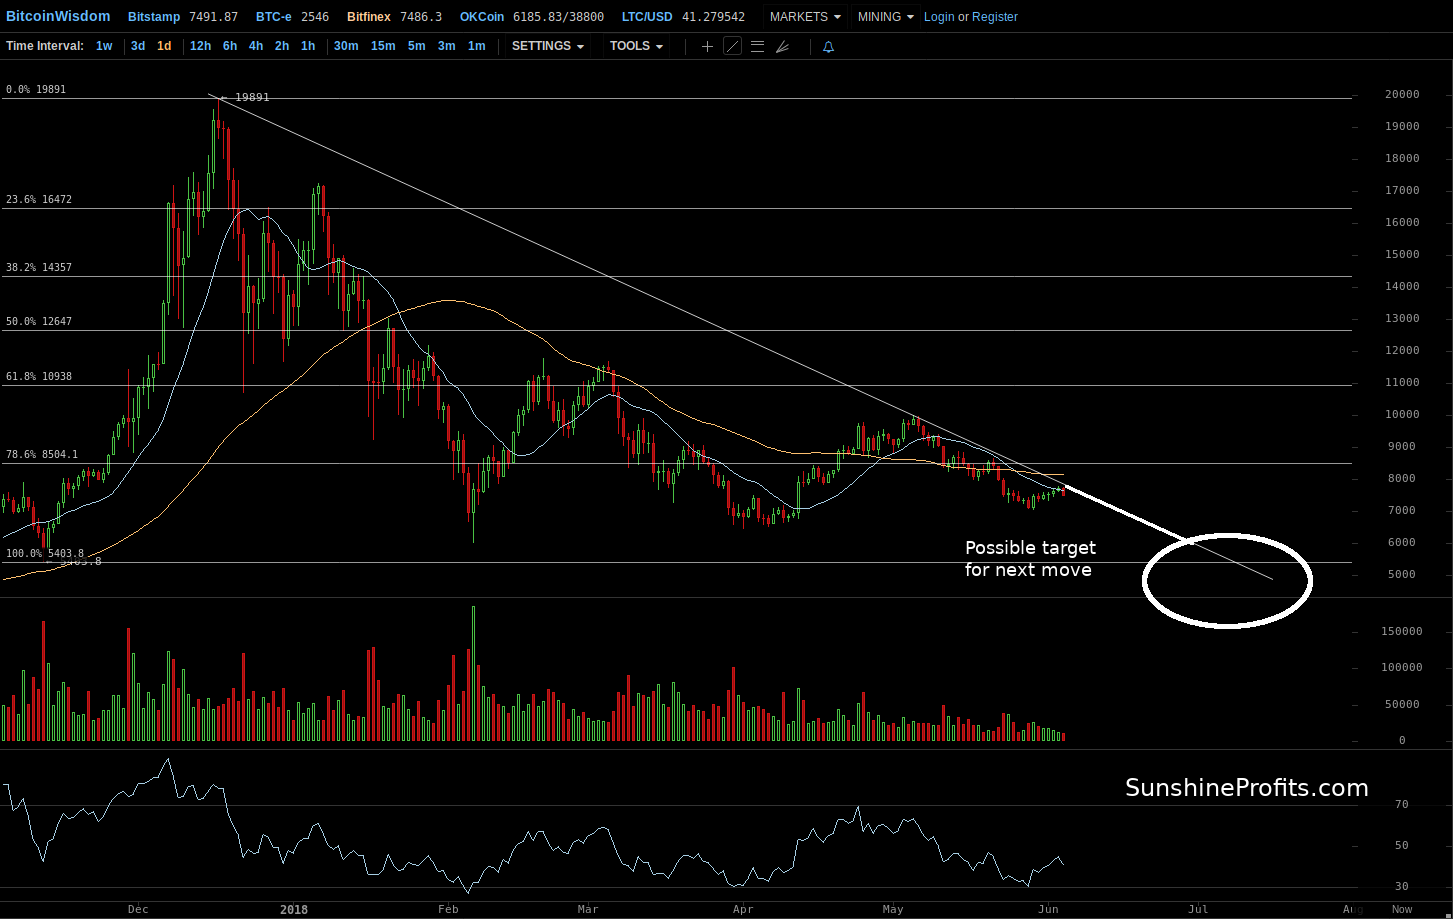
On the long-term Bitfinex chart, we see the depreciation from $10,000 and the recent appreciation in perspective. In particular, the recent move up does seem like a correction within a larger decline. This is further reinforced by the long-term declining trend line. It might be the case that today’s move down is a bounce back down off this line.
Additionally, we see that in spite of the recent move up, we haven’t really seen a move above the 78.6% retracement level based on the rally to the all-time high around $20,000/ Actually, it rather seems that we might have seen a verification of the breakdown below this level. This is a bearish indication, at least for the longer term.
The current situation is quite curious in terms of the price action. We are seeing a move up on relatively low volume followed by one day of depreciation and the current environment looks like the late stage of a short-term correction within a long-term decline. This means that, in our opinion, the situation is still bearish and we might see a stronger move to the downside in the next couple of weeks.
Summing up, the decline might resume and become even deeper.
