When playing Blackjack, the house has the edge in winning … unless you know how to count cards, a strategy proven to increase a player’s chances. But did you know you can apply this concept to the market as well?
While card-counting may get you barred from a casino, you can freely use patterns to your advantage in investing.
Take the Purchasing Manager’s Index (PMI), which gives us a reliable indication of the manufacturing sector’s well-being, as it gathers data such as global output, new orders, exports, prices, and employment. And because recessions tend to start and end with manufacturing activity, PMI can also be counted on as a measure of how well the economy is doing.
Investors can use the PMI data to improve their chances of positive returns in the market, as the math shows that with the positive momentum of PMI, commodities and commodity stocks build momentum as well.
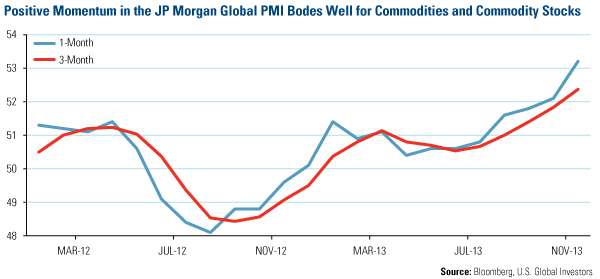
Take a look at the two-year trend in the JP Morgan Global Manufacturing PMI that is based on the results of surveys across 32 countries and accounts for 89 percent of global manufacturing output. As of November, the JP Morgan Global PMI has stayed above its longer three-month reading for the fifth month in a row. 
At the beginning of July 2013, we noted that the June Global PMI had crossed above the three-month number. Just like in card-counting when players place larger wagers when the deck has a favorable number of tens and aces, investors can shift their strategy when keeping a tally of these “cross-aboves” and building momentum.
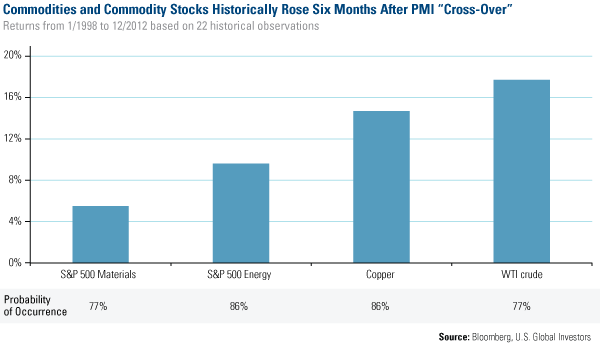
From January 1998 through December 2012, there were 22 times when the PMI rose above its three-month trendline. As you can see in the chart below, over the following six months, there was an 86 percent probability that copper would rise, resulting in a median return of 14.7 percent. The S&P Energy Index rose about 86 percent of the time and had a median return of 9.6 percent. Typically, WTI crude oil rose 77 percent of the time, with a median return of 17.7 percent. And the S&P 500 Materials Index rose 77 percent of the time, with a modest median return of 5.5 percent.  If investors were “counting these cards” since the PMI experienced a “cross-above,” they would have had a winning strategy, as the five-month returns for commodities and commodity stocks were comparatively consistent with history.
Since the beginning of July through the end of November, materials stocks in the S&P 500 jumped a spectacular 15.42 percent, the energy stocks in the S&P 500 rose 9.35 percent and copper climbed 5.9 percent. WTI crude oil was the only to buck its historical trend, falling about 4 percent.
While you may never know what card the market may play next, this “card counting” strategy has again tipped the odds in favor of the investor. And right now, with the global PMI building your momentum, it appears that the trend is your friend.
Disclosure: Past performance does not guarantee future results.
All opinions expressed and data provided are subject to change without notice. Some of these opinions may not be appropriate to every investor. The S&P 500 Energy Index is a capitalization-weighted index that tracks the companies in the energy sector as a subset of the S&P 500. The S&P 500 Materials Index is a capitalization-weighted index that tracks the companies in the material sector as a subset of the S&P 500.
