Research In Motion Limited (RIMM) is a designer, manufacturer and marketer of wireless solutions for the worldwide mobile communications market.
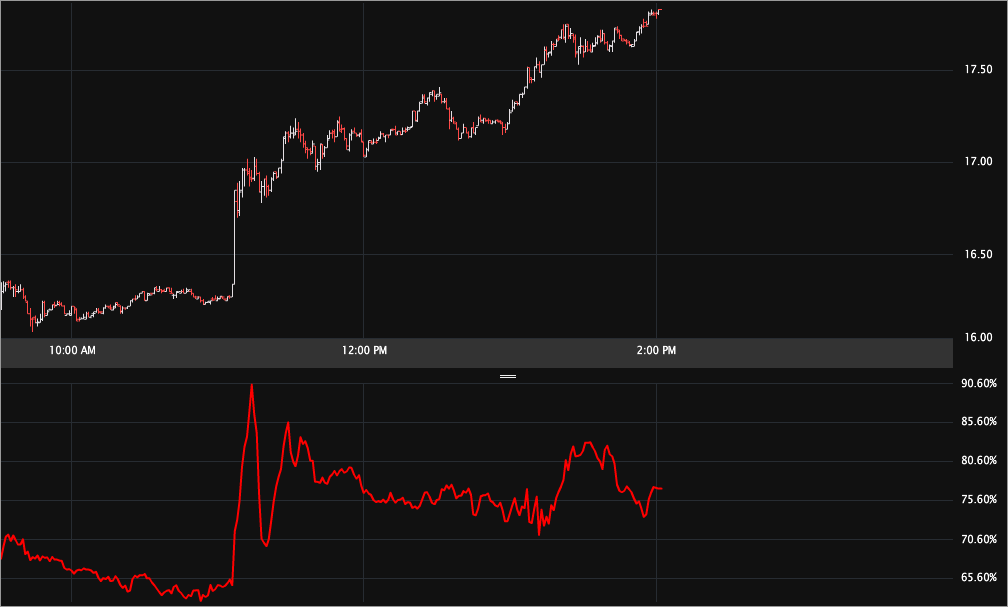
This is a vol / skew note along with some strong upside intraday stock movement. Let's start with the tick chart for today with a couple hours still left in the trading day. The top portion is the stock (today with one minute bars) and the bottom portion is the Jan vol (also one minute bars).
So what's the scoop? Here's a quick snippet from an article posted by MarketWatch:
Shares of Research In Motion Ltd. jumped nearly 7% to $17.25 early Tuesday afternoon after a technology blog reported that the company is considering a sale to Korean electronics giant Samsung. A report on the Boy Genius Report, citing unnamed sources, called a sale to Samsung a "front-runner" among several options currently being evaluated by RIM's management. "Jim is going hard after Samsung," one source told the blog, referring to RIM co-CEO Jim Balsille
Source: MarketWatch via Yahoo! Finance -- RIM shares up on report of Samsung interest, written by Dan Gallagher.
The news has not only pushed RIMM stock (it's actually over $17.90 as I'm writing), but the vol as well. Let's start with the Charts Tab (6 months), below. The top portion is the stock price, the bottom is the vol (IV30™ - red vs HV20 - blue vs HV180 - pink).
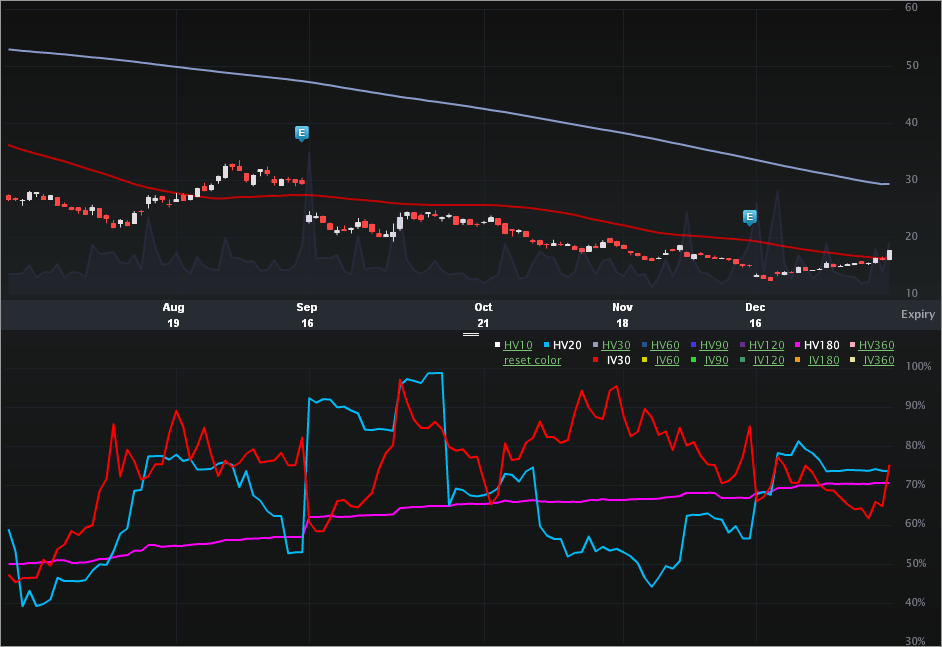
I've written ad nauseum about RIMM and the potential that the company is simply going away. I've postulated a few times "Is RIMM Risking Obsolescence?" I recall an analyst from.. somewhere... stating that there was a non trivial chance that RIMM would not exist by next holiday season. Gulp. The 52 wk high is $70.54 (whoa), while the 52 wk low is $12.54. On the vol portion of the chart we can see how the implied has popped over the last few trading sessions. As of this writing, the implied is up almost 25% from just six calendar days ago.
Let's turn to the Skew Tab, below.
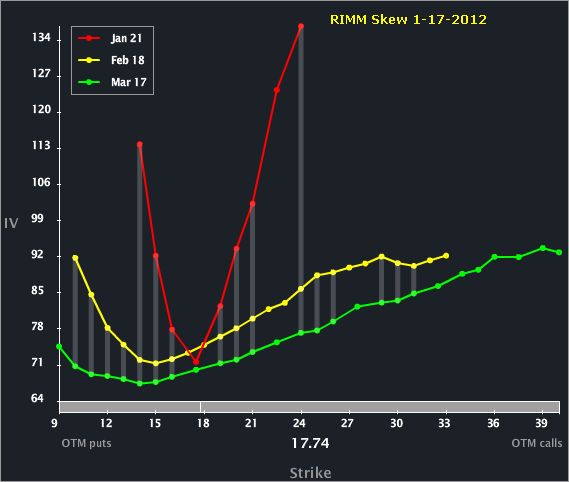
The skew in Jan is most notable (to me). The upside calls in Jan (and downside puts) are super bid. In fact, the Jan 20 calls are worth ~$0.10 with just three days and two trading hours to go before expo. RIMM hasn't closed above $20 since 10-31-2011. It's also interesting to note that RIMM upside skew is bid across all three of the front three months.
I took a look at the skew a month ago (12-13-2011), and it in fact demonstrates the same shape -- with the upside bid. I've included that snap, below.
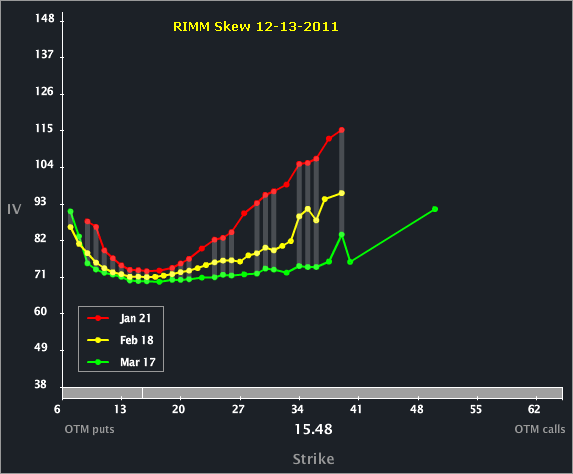
We can contrast the vol diff between Jan and the back two months now relative to in Dec. A part of that is simply how close we are to expiration.
Let's turn to the Options Tab, for completeness.
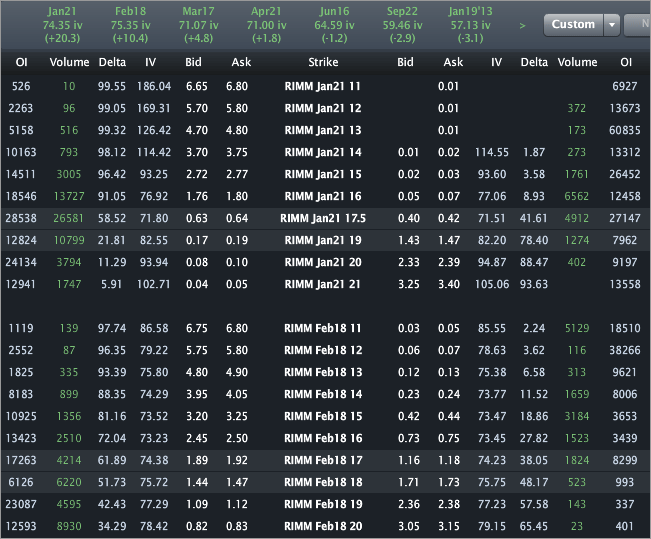
The ATM vols are actually quite similar priced to 71.50%, 75.75% and 70.5% for Jan, Feb and Mar (not pictured), respectively.
This is a vol / skew note along with some strong upside intraday stock movement. Let's start with the tick chart for today with a couple hours still left in the trading day. The top portion is the stock (today with one minute bars) and the bottom portion is the Jan vol (also one minute bars).

So what's the scoop? Here's a quick snippet from an article posted by MarketWatch:
Shares of Research In Motion Ltd. jumped nearly 7% to $17.25 early Tuesday afternoon after a technology blog reported that the company is considering a sale to Korean electronics giant Samsung. A report on the Boy Genius Report, citing unnamed sources, called a sale to Samsung a "front-runner" among several options currently being evaluated by RIM's management. "Jim is going hard after Samsung," one source told the blog, referring to RIM co-CEO Jim Balsille
Source: MarketWatch via Yahoo! Finance -- RIM shares up on report of Samsung interest, written by Dan Gallagher.
The news has not only pushed RIMM stock (it's actually over $17.90 as I'm writing), but the vol as well. Let's start with the Charts Tab (6 months), below. The top portion is the stock price, the bottom is the vol (IV30™ - red vs HV20 - blue vs HV180 - pink).

I've written ad nauseum about RIMM and the potential that the company is simply going away. I've postulated a few times "Is RIMM Risking Obsolescence?" I recall an analyst from.. somewhere... stating that there was a non trivial chance that RIMM would not exist by next holiday season. Gulp. The 52 wk high is $70.54 (whoa), while the 52 wk low is $12.54. On the vol portion of the chart we can see how the implied has popped over the last few trading sessions. As of this writing, the implied is up almost 25% from just six calendar days ago.
Let's turn to the Skew Tab, below.

The skew in Jan is most notable (to me). The upside calls in Jan (and downside puts) are super bid. In fact, the Jan 20 calls are worth ~$0.10 with just three days and two trading hours to go before expo. RIMM hasn't closed above $20 since 10-31-2011. It's also interesting to note that RIMM upside skew is bid across all three of the front three months.
I took a look at the skew a month ago (12-13-2011), and it in fact demonstrates the same shape -- with the upside bid. I've included that snap, below.

We can contrast the vol diff between Jan and the back two months now relative to in Dec. A part of that is simply how close we are to expiration.
Let's turn to the Options Tab, for completeness.

The ATM vols are actually quite similar priced to 71.50%, 75.75% and 70.5% for Jan, Feb and Mar (not pictured), respectively.
