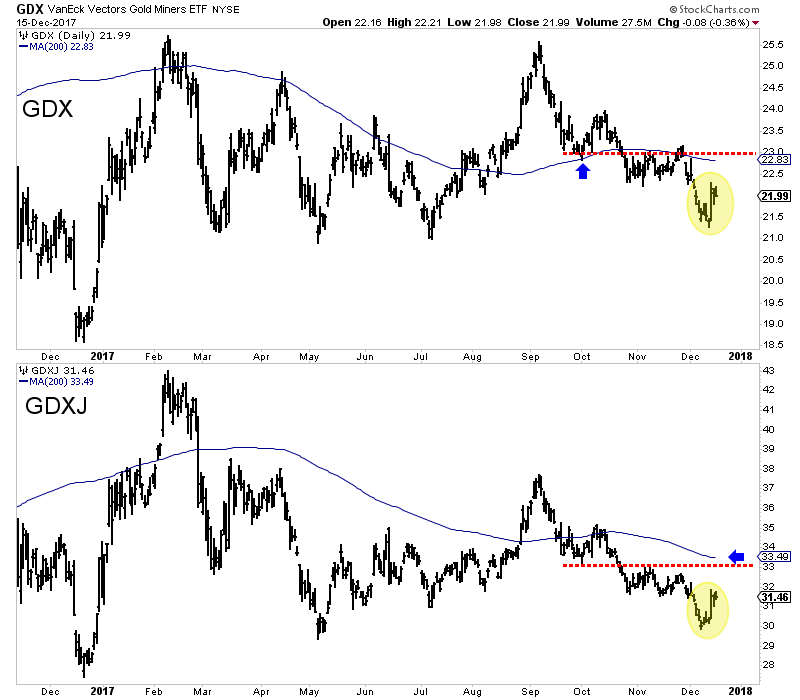
In recent days the gold stocks (GDX (NYSE:GDX), GDXJ) traded within 1% of our downside targets of GDX $21.00 and VanEck Vectors Junior Gold Miners (NYSE:GDXJ) $29.50. Last week we wrote: “the miners are getting oversold and a bounce could begin from those levels.” GDXJ troughed first last week at $29.84 while GDX printed a low of $21.27 on Monday. From their September peaks down to those lows, GDX and GDXJ had declined nearly 17% and 21% respectively. They are oversold, nearly touched good support and now the rate hike is behind them. We expect a rally in the sector well into January.
With a rebound underway we should turn our attention to potential upside targets. GDX closed the week at $21.99. It has resistance at $23.00 including its 200-day moving average at $22.83. GDXJ closed at $31.46. It has resistance at $33.00. Its 200-day moving average is at $33.49. In case we are being too conservative, our optimistic upside targets would be GDX $23.50 and GDXJ $33.50.

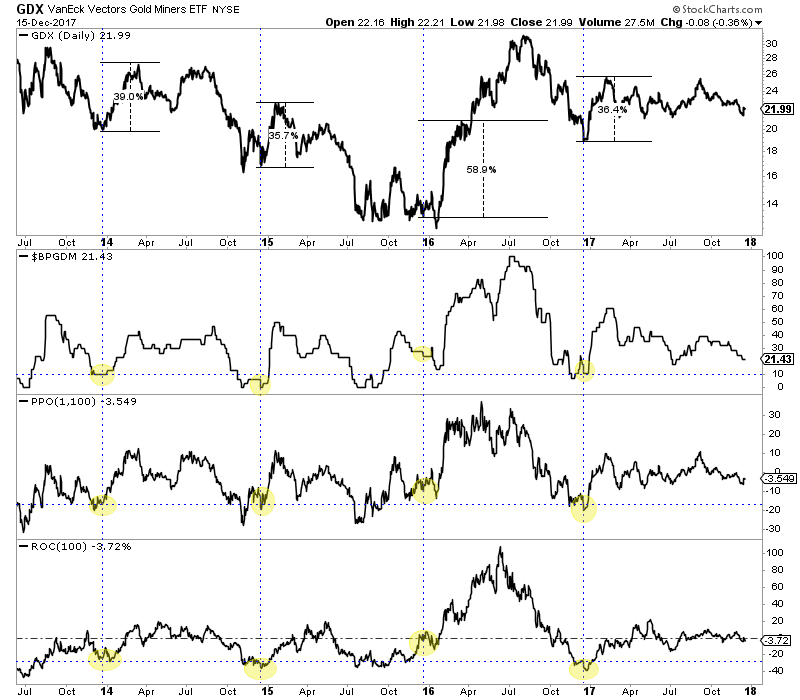
While mid to late December has been an excellent buy point over each of the past four years, we do not expect the gold stocks (this time) to match those fabulous returns. The gold stocks are not currently as oversold as they were in each of the past four years. The bullish percentage index (BPI), a breadth indicator is currently at 21.4%. Aside from the December 2015 low (which came in January 2016 at a BPI of 12%), the BPI at previous lows did not exceed 10%. Furthermore, a look at the rolling rate of change for 100 days and GDX’s distance from its 100-day exponential moving average shows that GDX currently is nowhere close to as oversold as those four previous points.

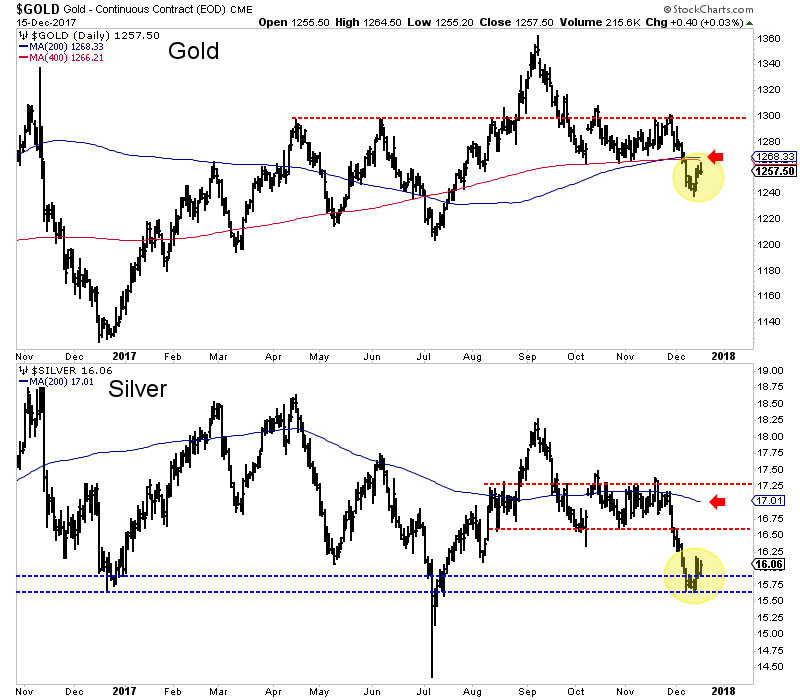
Another reason we should not expect a sizeable rebound is metals prices do not have much room to rally before running into strong resistance. Gold closed the week at $1257. It faces long-term moving average resistance at $1266-$1268 and very strong resistance above $1280. Silver meanwhile could find strong resistance at $16.60 to $16.75. Its 200-day moving average is at $17.01 and declining. Silver closed the week at $16.06.

Precious metals and gold stocks especially have begun a rebound that should last at least three or four more weeks. Due to a lack of an extreme “long-term” oversold condition (like in each of the past four December’s) and the presence of nearby overhead resistance, we would not expect sizeable gains. Another reason is strong fundamentals for precious metals (namely declining real interest rates) are not yet in place. With all that being said, some values are starting to emerge in the juniors and the sentiment in the sector has become encouraging from a contrarian standpoint. Conditions are improving but it remains early to be outright bullish on the sector. In the meantime, the key for traders and investors is to find the oversold companies with strong fundamentals with value and catalysts that will drive buying
