
Friday’s 175K Nonfarm payroll gains rekindled Fed tapering off expectations, sparking a possible reversal to almost two weeks of dollar weakening. Markets were expecting around 163K to 170K gains but an increase in service sector jobs greater than the 6-month average led to a beat despite construction increases being far fewer than their 6-month average and manufacturing payrolls decreasing 8K, when a rise of 4K was expected. The negative news of an unanticipated increase in the unemployment rate from 7.5% to 7.6% was mollified as it was attributed to a surprise increase in the labour force, raising labour force participation from its 35-year low of 63.3% to 63.4%. On the negative side, however, average hourly earnings of employees came in lower than forecasted with last month’s 165k figure being revised downwards to 149k. The headline beat led to an initial overreaction, with the dollar experiencing substantial gains before retracing various portions of those gains versus the majors. The job gains kept on the table a possible Fed cut-down in its asset-buying programme but expectations place such a move late in October, reviving the stimulus-benefited U.S. stocks, with the three major stock indices gaining 1.3%.
The Commitment of Traders report for the week ending 4th of June showed significant reductions in gross short positions on the euro and the yen but given the U.S. employment report released in the meantime, the CFTC report may be seen as somewhat dated.
The French and Italian MoM industrial outputs for April are reported this morning. France is expected to show a 0.3% increase, substantially improved from the 0.9% contraction experienced in March. Italy is forecasted to see no change, halting the two consecutive months of decline, with March’s output decreasing 0.8%. The Italian public deficit to GDP ratio for Q1 is out with no forecast available.
Canadian housing starts and the UK’s RICS Housing Price Balance, both for May, are due out. Canadian starts are expected to show an increase from 174.9K to 179.1K, with UK house prices forecasted to show a second consecutive monthly increase, from 1.0% to 3.0%.
The centrist (3 out of 5 on Reuters’ Fed dove/hawk scale) St. Louis Fed President James Bullard is scheduled to give a speech in Montreal on the global economic outlook, the first speech by a Fed official since Friday’s nonfarm payrolls.
Overnight we have a series of Japanese figures. The large manufacturing business survey index for Q2, with an improvement anticipated relative to the previous quarter as fewer firms believe that domestic economic conditions are declining. The indicator is expected to move from -4.6 to -2.1. M2 money supply and certificates of deposits are due to increase YoY from 3.3% to 3.5%. The BoJ interest rate is set to remain fixed at 0.1% although there is some speculation the central bank will resort to new stimulus measures to spur growth in its attempt to generate inflation.
Overnight we also have the National Australia Bank’s business confidence and conditions for May as well as April’s home loans and investment lending for homes. Only MoM home loans come with a forecast, with a slowdown expected from 5.2% to 2.0%.
Major news this week: New Zealand’s interest rate decision is announced on Tuesday, with no one expecting a change from 2.5%. The U.K. and Australian unemployment rates, released on Wednesday and Thursday respectively are forecasted to show no change for the former and deterioration for the latter. U.S. retail sales are also reported on Thursday, with the Eurozone CPI announced on Friday; both are expected to show an increase.
The Market
EUR/USD 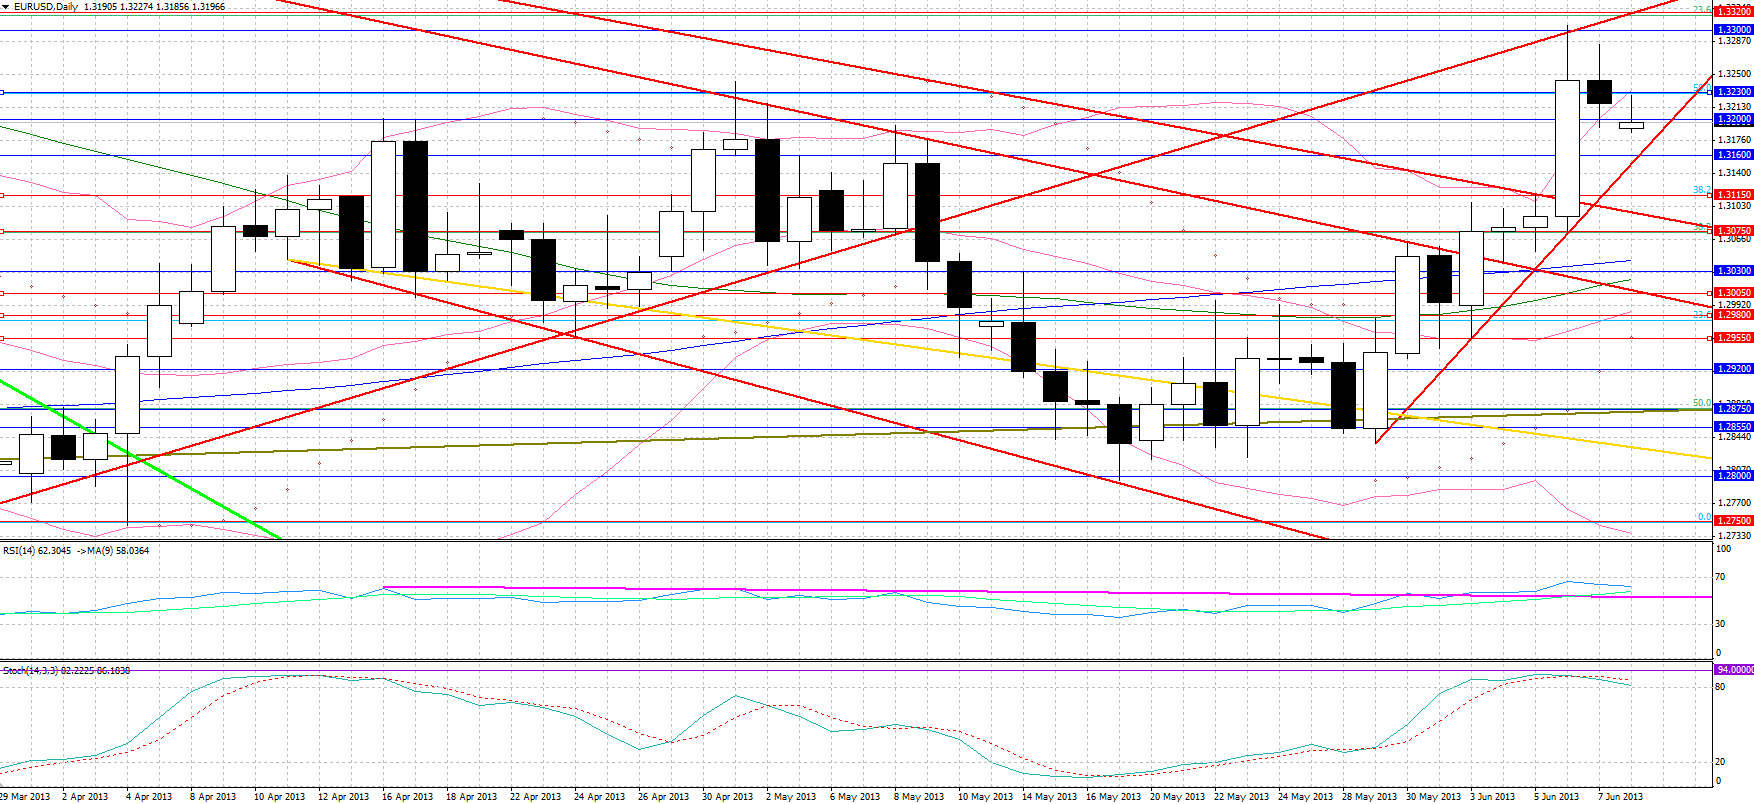 EUR/USD" title="EUR/USD" width="1758" height="808">
The mixed U.S. employment report caused substantial volatility on the pair minutes after the figures were released as the markets were absorbing the metrics trying to come to a directional conclusion. Resistance came just before the major 1.3300 level with support coming at 1.3200, and a rebound finding resistance at 1.3240.
• Resistance for the day comes at 1.3200 and 1.3230, the 50% retracement level of the February – March decline, with further strong resistance in the 1.3300 – 1.3320 area. The harami candlestick pattern, with a large white candlestick followed by a spinning top with its body within the first candle points to a possible reversal, with the bearish Stochastics crossover adding to that. Trendline support is found at 1.3160 with further support at 1.3115, the 38.2% retracement level of the aforementioned decline.
USD/JPY 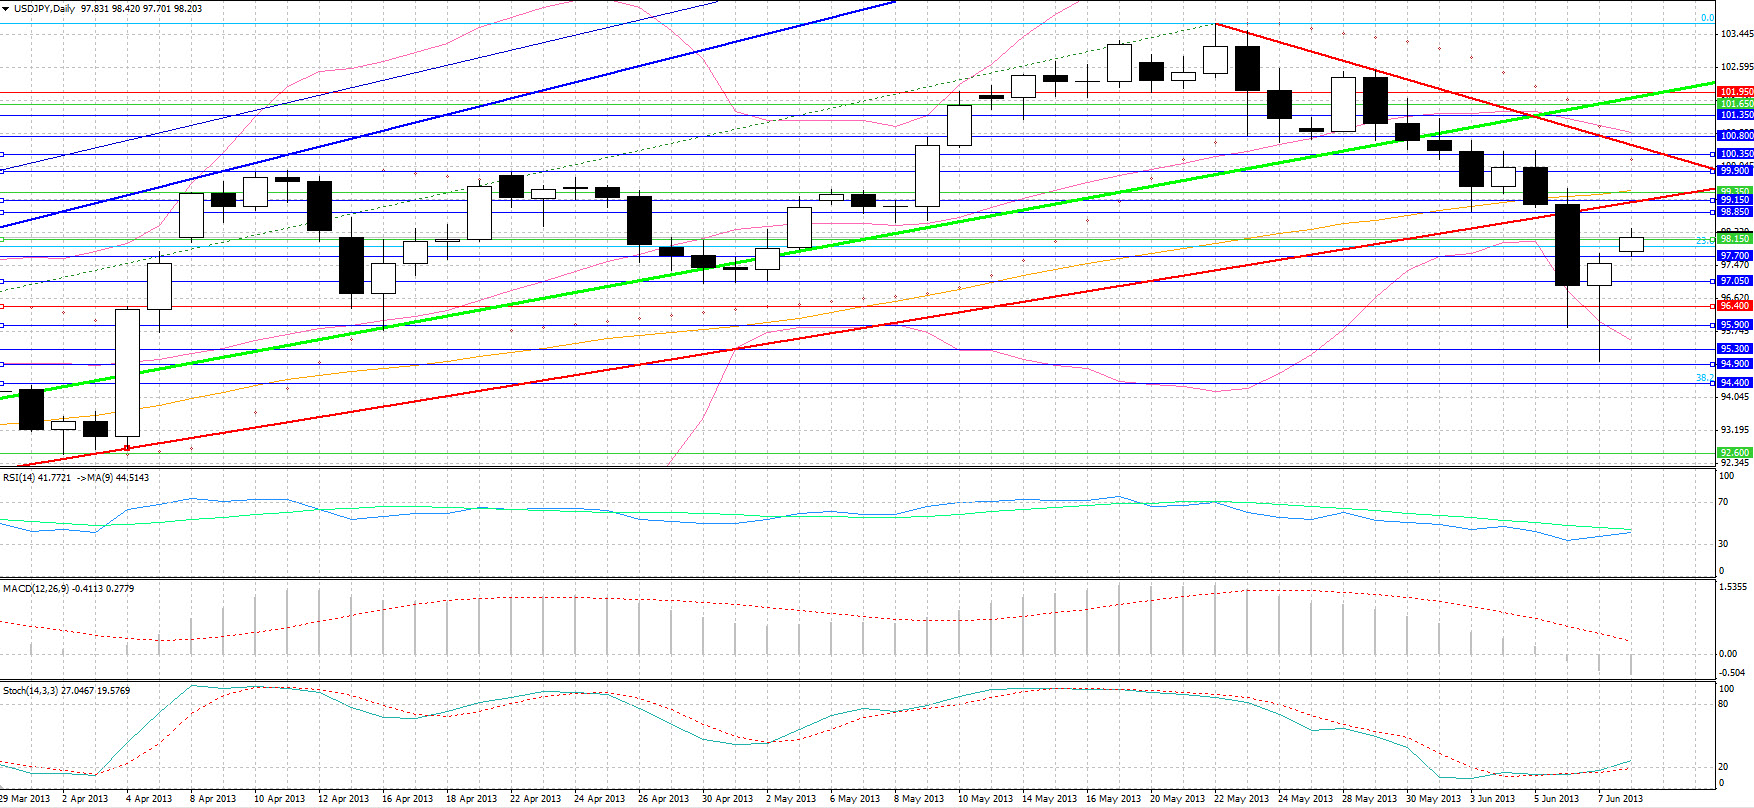 USD/JPY" title="USD/JPY" width="1758" height="808">
USD/JPY rebounded from 94.90 support following the announcement of the NFP figure. Resistance came at 97.70 with an upward gap today driving the pair to 98.40 resistance before retracing to 97.70 following the release of a twice-than-expected Japanese current account surplus, and an upward revision in Japan’s annualized GDP from 3.5% to 4.1%, which strengthened the yen. Friday’s hammer candlestick points to a possible bottom with the RSI on the verge of moving above its 9-day MA for the first time in almost 4 weeks. That said, we need to note that the BoJ started today its two-day policy meeting, with the lack of further stimulus measure announcements tomorrow possibly placing some downward pressures on the pair.
• Support is seen at 97.70, 97.05 and 96.40 with resistance coming at 98.15, 98.85 and 99.35, the 50-day MA. Trendline resistance may be seen at 99.15, the former support trendline that held for 6 months.
AUD/USD 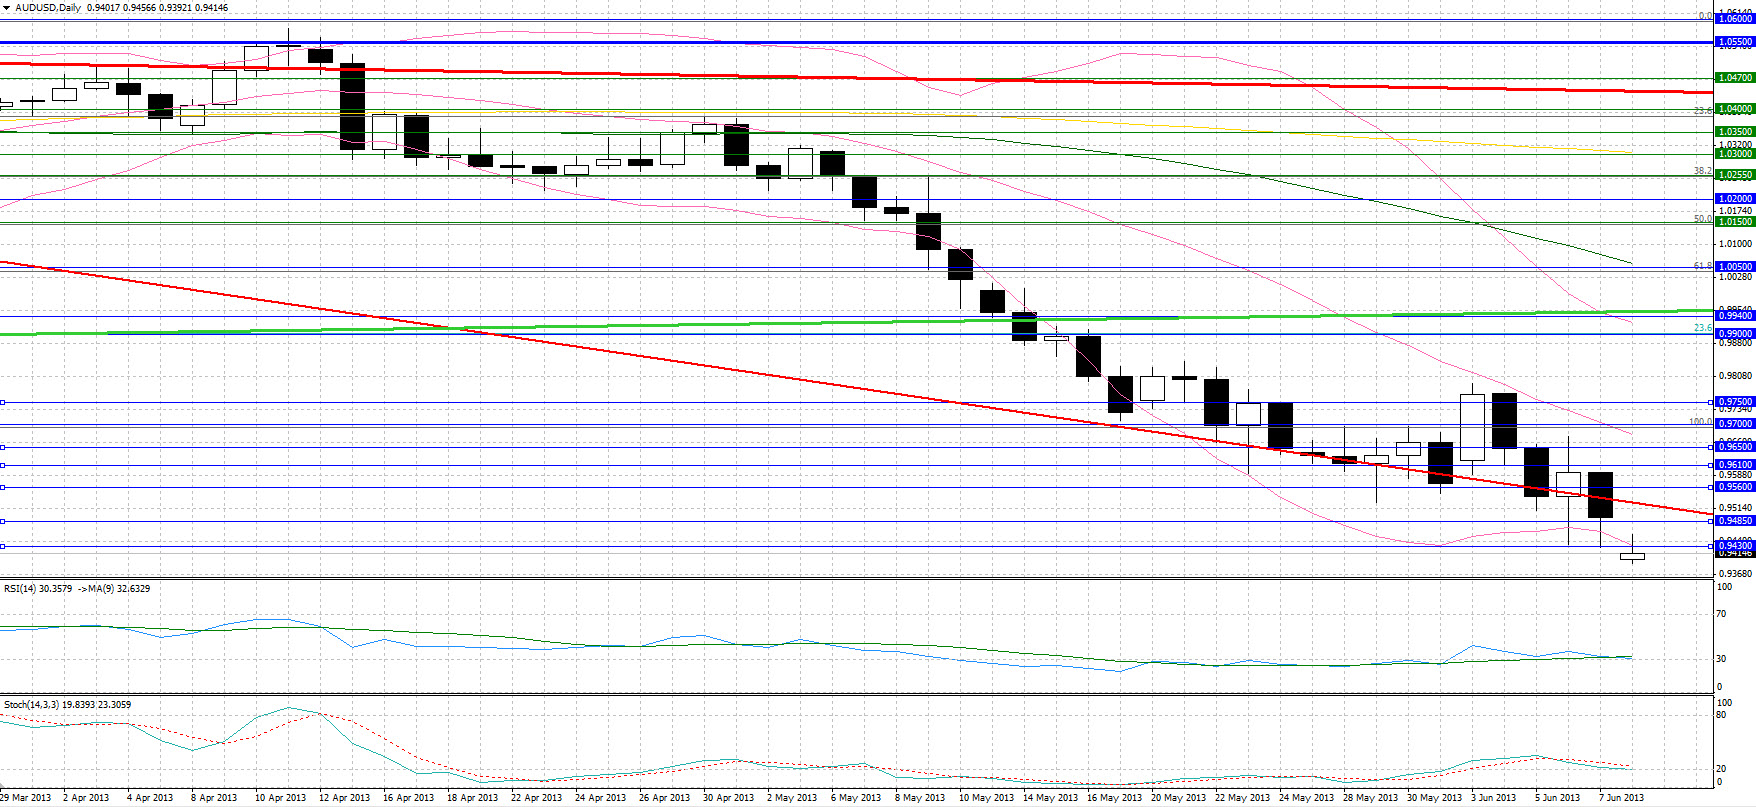 AUD/USD" title="AUD/USD" width="1758" height="808">
The plummeting of the Aussie has yet to come to an end, with the U.S. employment report retesting support at 0.9430. The higher-than-expected Chinese trade balance on account of a decrease in imports, lower-than-forecasted industrial production and the larger-than-estimated deflationary CPI (MoM) and PPI (YoY) indices for May released over the weekend led to a 90 pip downward gap.
• Resistance is likely to come at 0.9430 and 0.9485 with support found at 0.9350, 0.9290 and 0.9230, the 38.2% retracement level of the massive bull run from March 2009 to May 2011.
Gold
The precious metals plunged as the dollar strengthened, with gold losing 2% since Friday morning. The generally positive employment outlook in the U.S. leading to equity gains tainted gold’s shine.
• Support is seen at $1385, the 23.6% retracement level of the April crash, with further support at $1370. Solid resistance is likely to come at $1400 with further resistance at $1423.
Oil
WTI was a major gainer on Friday, having appreciated by 1.5% since Friday morning. The positive economic outlook generated by the more-than-forecasted U.S. job gains led to a breakout from $94.45 and $95.50 resistance with major trendline resistance, which extends from the 2008 peak, coming in at $96.40.
• A breakout from the significant resistance found at $96.40 may see 9-month long trendline resistance at $97.00, with further resistance at $97.75. Support is seen at the previous levels of $95.50, 94.45, and $94.05.
BENCHMARK CURRENCY RATES - DAILY GAINERS AND LOSERS
MARKETS SUMMARY
- English (UK)
- English (India)
- English (Canada)
- English (Australia)
- English (South Africa)
- English (Philippines)
- English (Nigeria)
- Deutsch
- Español (España)
- Español (México)
- Français
- Italiano
- Nederlands
- Português (Portugal)
- Polski
- Português (Brasil)
- Русский
- Türkçe
- العربية
- Ελληνικά
- Svenska
- Suomi
- עברית
- 日本語
- 한국어
- 简体中文
- 繁體中文
- Bahasa Indonesia
- Bahasa Melayu
- ไทย
- Tiếng Việt
- हिंदी
Rekindled Reversal: Jobs Report Leads To Dollar Gains
Published 06/10/2013, 03:31 AM
Updated 07/09/2023, 06:31 AM
Rekindled Reversal: Jobs Report Leads To Dollar Gains
Latest comments
Loading next article…
Install Our App
Risk Disclosure: Trading in financial instruments and/or cryptocurrencies involves high risks including the risk of losing some, or all, of your investment amount, and may not be suitable for all investors. Prices of cryptocurrencies are extremely volatile and may be affected by external factors such as financial, regulatory or political events. Trading on margin increases the financial risks.
Before deciding to trade in financial instrument or cryptocurrencies you should be fully informed of the risks and costs associated with trading the financial markets, carefully consider your investment objectives, level of experience, and risk appetite, and seek professional advice where needed.
Fusion Media would like to remind you that the data contained in this website is not necessarily real-time nor accurate. The data and prices on the website are not necessarily provided by any market or exchange, but may be provided by market makers, and so prices may not be accurate and may differ from the actual price at any given market, meaning prices are indicative and not appropriate for trading purposes. Fusion Media and any provider of the data contained in this website will not accept liability for any loss or damage as a result of your trading, or your reliance on the information contained within this website.
It is prohibited to use, store, reproduce, display, modify, transmit or distribute the data contained in this website without the explicit prior written permission of Fusion Media and/or the data provider. All intellectual property rights are reserved by the providers and/or the exchange providing the data contained in this website.
Fusion Media may be compensated by the advertisers that appear on the website, based on your interaction with the advertisements or advertisers.
© 2007-2024 - Fusion Media Limited. All Rights Reserved.