The 1-year outlook for the Gold bullion ETF (GLD) based on linear regression projections and volatility-based 96% price probability ranges, sees a spread of price possibilities from a high of about $204 to a low of about $134. That relates generally to gold bullion prices of about $2,040 to $1,340.
One additional point would be based on a market disruption similar to the one in 2008 due to the fiscal cliff being bungled, or some other equally nasty macro event. GLD declined 30% from its peak to its 2008 low. A 30% decline from the 2011 high for GLD would bring the price down to about $125.
Note: Figure 1 below uses historical data, while Figures 2 and 3 use options derived data. The historical data by definition is based on what has actually been happening with the security, and the projections assume more of the same. The options data is based on what traders think is going to happen, which is a forward looking view, and which tends to change more day-to-day than the projections based on historical data.
Figure 1:
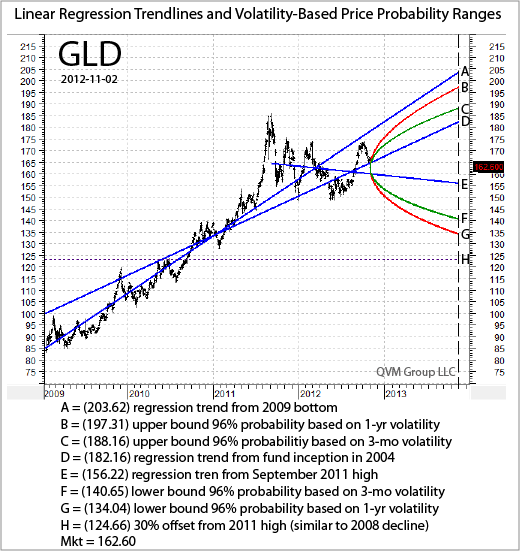
Figure 1 uses historical price data and plots the linear regression trend lines and the volatility-based 96% probability price ranges for GLD.
The linear regression lines were plotted from (a) the fund’s inception in 2004, (b) the low in 2009, and (c) the high in 2011.
The price probability ranges were plotted using a 96% probability based on 252-day (1-year) and 63-day (3-month) historical price volatility.
The “96% probability” (for data points B, C, F and G) refers to the price falling within the upper and lower bounds of the probability cone, not the probability of the bounds being reached.
Overall the extremes of these statistical projections has a +/- price change from the current market price of about + 25% and about -23%.
The long-term trend lines are obviously up, and the intermediate-term trend line is moderately down, presumably due to concerns about possible recession in 2013 over the fiscal cliff, but that is just supposition.
Options Related GLD Price Levels at Various Dates and Volatility Levels:
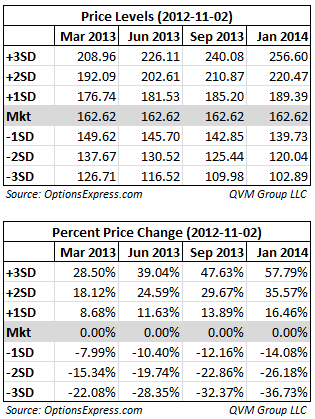
Using options data from OptionsExpress, Figure 2 shows the prices that are 1, 2, and 3 standard deviations away from the current market price for GLD for these contract expiration dates; March 2013, June 2013, September 2013 and January 2014. The upper matrix shows the prices at the standard deviation levels. The lower matrix shows the percentage change in the price of GLD required to achieve the prices at each standard deviation level.
Figure 2:
The $204 November 2013 regression projection from the 2009 bottom (Figure 1 : A) falls between the 1 and 2 standard deviation price levels for the September 2013 and January 2014 options contracts.
The $182 November 2013 regression projection from the inception of the fund (Figure 1: D) lies below the 1 standard deviation price levels for the September 2013 and January 2014 options contracts.
The $197 and $188 November 2013 upper projections based on 1-year and 3-month historical volatility (Figure 1: B and C) lie between those two regression projections (Figure 1: A and D).
The $156 November 2013 regression projection from 2011 high (Figure 1: E) falls significantly below the 1 standard deviation price levels for the September 2013 and January 2014 options contracts.
The $141 November 2013 lower projection based on 3-month historical volatility (Figure 1: F) lies very close to the 1 standard deviation price level for the September 2013 and January 2014 options contracts.
The $134 November 2013 lower projection based on 1-year historical volatility (Figure 1: G) lies between the 1 and 2 standard deviation price levels for the September 2013 and January 2014 options contracts, but closer to the 1 standard deviation level.
The $125 30% offset from the 2011 high (Figure 1: H) lies essentially on the 2 standard deviation level for the September 2013 options contract, and between the 1 and 2 standard deviation level for the January 2014 contract.
Options-Based Probability of Price Levels For Various Contract Expiration Dates:
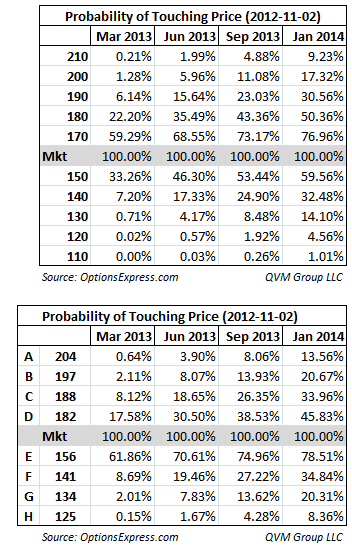
Figure 3 shows the probability of the price of GLD touching the indicated levels sometime during the life of the options contract for the contracts expiring in March 2013, June 2013, September 2013 and January 2014. The probabilities are based on the volatility implied by those options contracts at this time. The upper matrix shows touch probabilities for prices at $10 increments. The bottom matrix shows the touch probabilities for prices from the A-H indicators in Figure 1.
Figure 3:
Disclosure: QVM has some long positions in GLD and sells covered Calls and cash secured Puts on GLD.
- English (UK)
- English (India)
- English (Canada)
- English (Australia)
- English (South Africa)
- English (Philippines)
- English (Nigeria)
- Deutsch
- Español (España)
- Español (México)
- Français
- Italiano
- Nederlands
- Português (Portugal)
- Polski
- Português (Brasil)
- Русский
- Türkçe
- العربية
- Ελληνικά
- Svenska
- Suomi
- עברית
- 日本語
- 한국어
- 简体中文
- 繁體中文
- Bahasa Indonesia
- Bahasa Melayu
- ไทย
- Tiếng Việt
- हिंदी
Regression And Volatility-Based 1-Yr GLD Price Projections
Published 11/04/2012, 05:36 AM
Updated 07/09/2023, 06:31 AM
Regression And Volatility-Based 1-Yr GLD Price Projections
Latest comments
Loading next article…
Install Our App
Risk Disclosure: Trading in financial instruments and/or cryptocurrencies involves high risks including the risk of losing some, or all, of your investment amount, and may not be suitable for all investors. Prices of cryptocurrencies are extremely volatile and may be affected by external factors such as financial, regulatory or political events. Trading on margin increases the financial risks.
Before deciding to trade in financial instrument or cryptocurrencies you should be fully informed of the risks and costs associated with trading the financial markets, carefully consider your investment objectives, level of experience, and risk appetite, and seek professional advice where needed.
Fusion Media would like to remind you that the data contained in this website is not necessarily real-time nor accurate. The data and prices on the website are not necessarily provided by any market or exchange, but may be provided by market makers, and so prices may not be accurate and may differ from the actual price at any given market, meaning prices are indicative and not appropriate for trading purposes. Fusion Media and any provider of the data contained in this website will not accept liability for any loss or damage as a result of your trading, or your reliance on the information contained within this website.
It is prohibited to use, store, reproduce, display, modify, transmit or distribute the data contained in this website without the explicit prior written permission of Fusion Media and/or the data provider. All intellectual property rights are reserved by the providers and/or the exchange providing the data contained in this website.
Fusion Media may be compensated by the advertisers that appear on the website, based on your interaction with the advertisements or advertisers.
© 2007-2025 - Fusion Media Limited. All Rights Reserved.
