
U.S. energy giant Chevron Corp. (NYSE:CVX) reported strong third-quarter results amid the recovery in commodity prices, production gains and robust refining profits. The company reported earnings per share of $1.03, higher than the Zacks Consensus Estimate of 99 cents and the year-ago profit of 68 cents.
Quarterly revenue of $36,205 million surpassed the Zacks Consensus Estimate of $33,667 million and were up 20.1% year over year.
Chevron becomes the second integrated supermajor after ExxonMobil Corp. (NYSE:XOM) in reporting third quarter numbers. European rivals Royal Dutch Shell (LON:RDSa) plc RDS.A and BP plc (NYSE:BP) are scheduled to report during the next week.
Segment Performance
Upstream: Chevron’s total production of crude oil and natural gas increased 8.1% compared with last year’s corresponding period to 2,717 thousand oil-equivalent barrels per day (MBOE/d). The U.S. output decreased 2.4% year over year to 681 MBOE/d but the company’s international operations (accounting for 75% of the total) was up 12.2% to 2,036 MBOE/d.
Apart from the core business in Gulf of Mexico, the rise in output could be attributed to contributions from major capital projects – Gorgon and Angola LNG – shale assets, as well as and lower downtime associated with maintenance activities.
The rise in production was supported by higher oil realizations, the result being a healthy improvement in Chevron’s upstream segment profit – from $454 million in the year-earlier quarter to $489 million.
Downstream: Chevron’s downstream segment achieved earnings of $1,814 million, a massive 70.3% higher than the profit of $1,065 million last year. The jump primarily underlined increase in domestic refining margins and gains from international asset sales.
Cash Flows
Importantly, Chevron delivered a good cash flow performance this quarter – an important gauge for the oil and gas industry – with $5,370 million in cash flow from operations, up from $5,311 million a year ago.
Costs & Expenses
Exploration costs fell from $258 million in the third quarter of 2016 to $239 million. The second-largest U.S. oil company by market value after ExxonMobil spent $4,456 million in capital expenditures during the quarter, a considerable decline from the $5,175 million incurred a year ago. Roughly 88% of the total outlays pertained to upstream projects.
Balance Sheet
As of Sep 30, the San Ramon, CA-based Zacks Rank #3 (Hold) company had $6,641 million in cash and total debt of $41,972 million, with a debt-to-total capitalization ratio of about 22.2%. You can see the complete list of today’s Zacks #1 Rank (Strong Buy) stocks here.
Share Performance
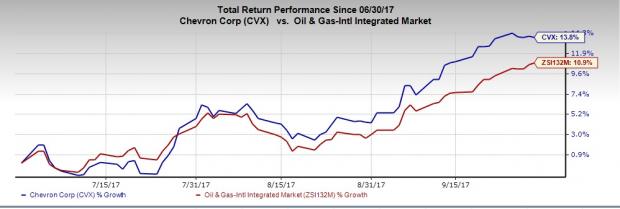
Shares of Chevron have gained 13.8% during the third quarter, outperforming the industry's 10.8% increase.
Wall Street’s Next Amazon (NASDAQ:AMZN)
Zacks EVP Kevin Matras believes this familiar stock has only just begun its climb to become one of the greatest investments of all time. It’s a once-in-a-generation opportunity to invest in pure genius.
BP p.l.c. (BP): Free Stock Analysis Report
Chevron Corporation (CVX): Free Stock Analysis Report
Royal Dutch Shell PLC (RDS.A): Free Stock Analysis Report
Exxon Mobil Corporation (XOM): Free Stock Analysis Report
Original post
Zacks Investment Research