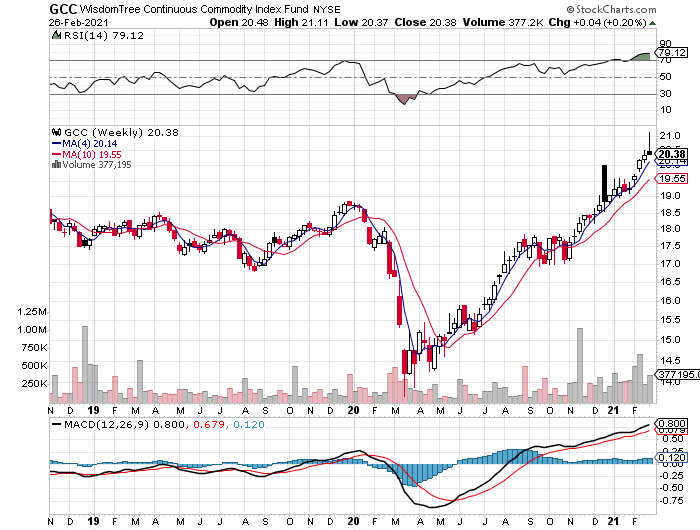
Nearly every slice of our global opportunity set for the major asset classes felt pain last week. The exception: commodities, or at least commodities overall when equally weighted via WisdomTree Continuous Commodity Index Fund (NYSE:GCC).
GCC managed to provide a wee bit of ballast in a week that was oversupplied in red ink. The ETF edged up 0.2% for the five trading days through Friday's close (Feb. 26). And in case you haven’t been watching, that’s the fifth straight weekly advance, presumably powered by renewed inflation worries of late.
To be fair, GCC was up sharply earlier in the week, but succumbed to financial gravity on Thursday and Friday. But the sharp reversal at the end of the week still left the fund with a modest gain, which is more than you can say for the rest of the field.
Losses elsewhere across our ETF proxies for the major asset classes ranged from a modest 0.1% weekly decline for foreign property shares—Vanguard Global ex-U.S. Real Estate Index Fund ETF Shares (NASDAQ:VNQI) to a body blow for Latin/South America shares—iShares Latin America 40 ETF (NYSE:ILF), which tumbled more than 8%.
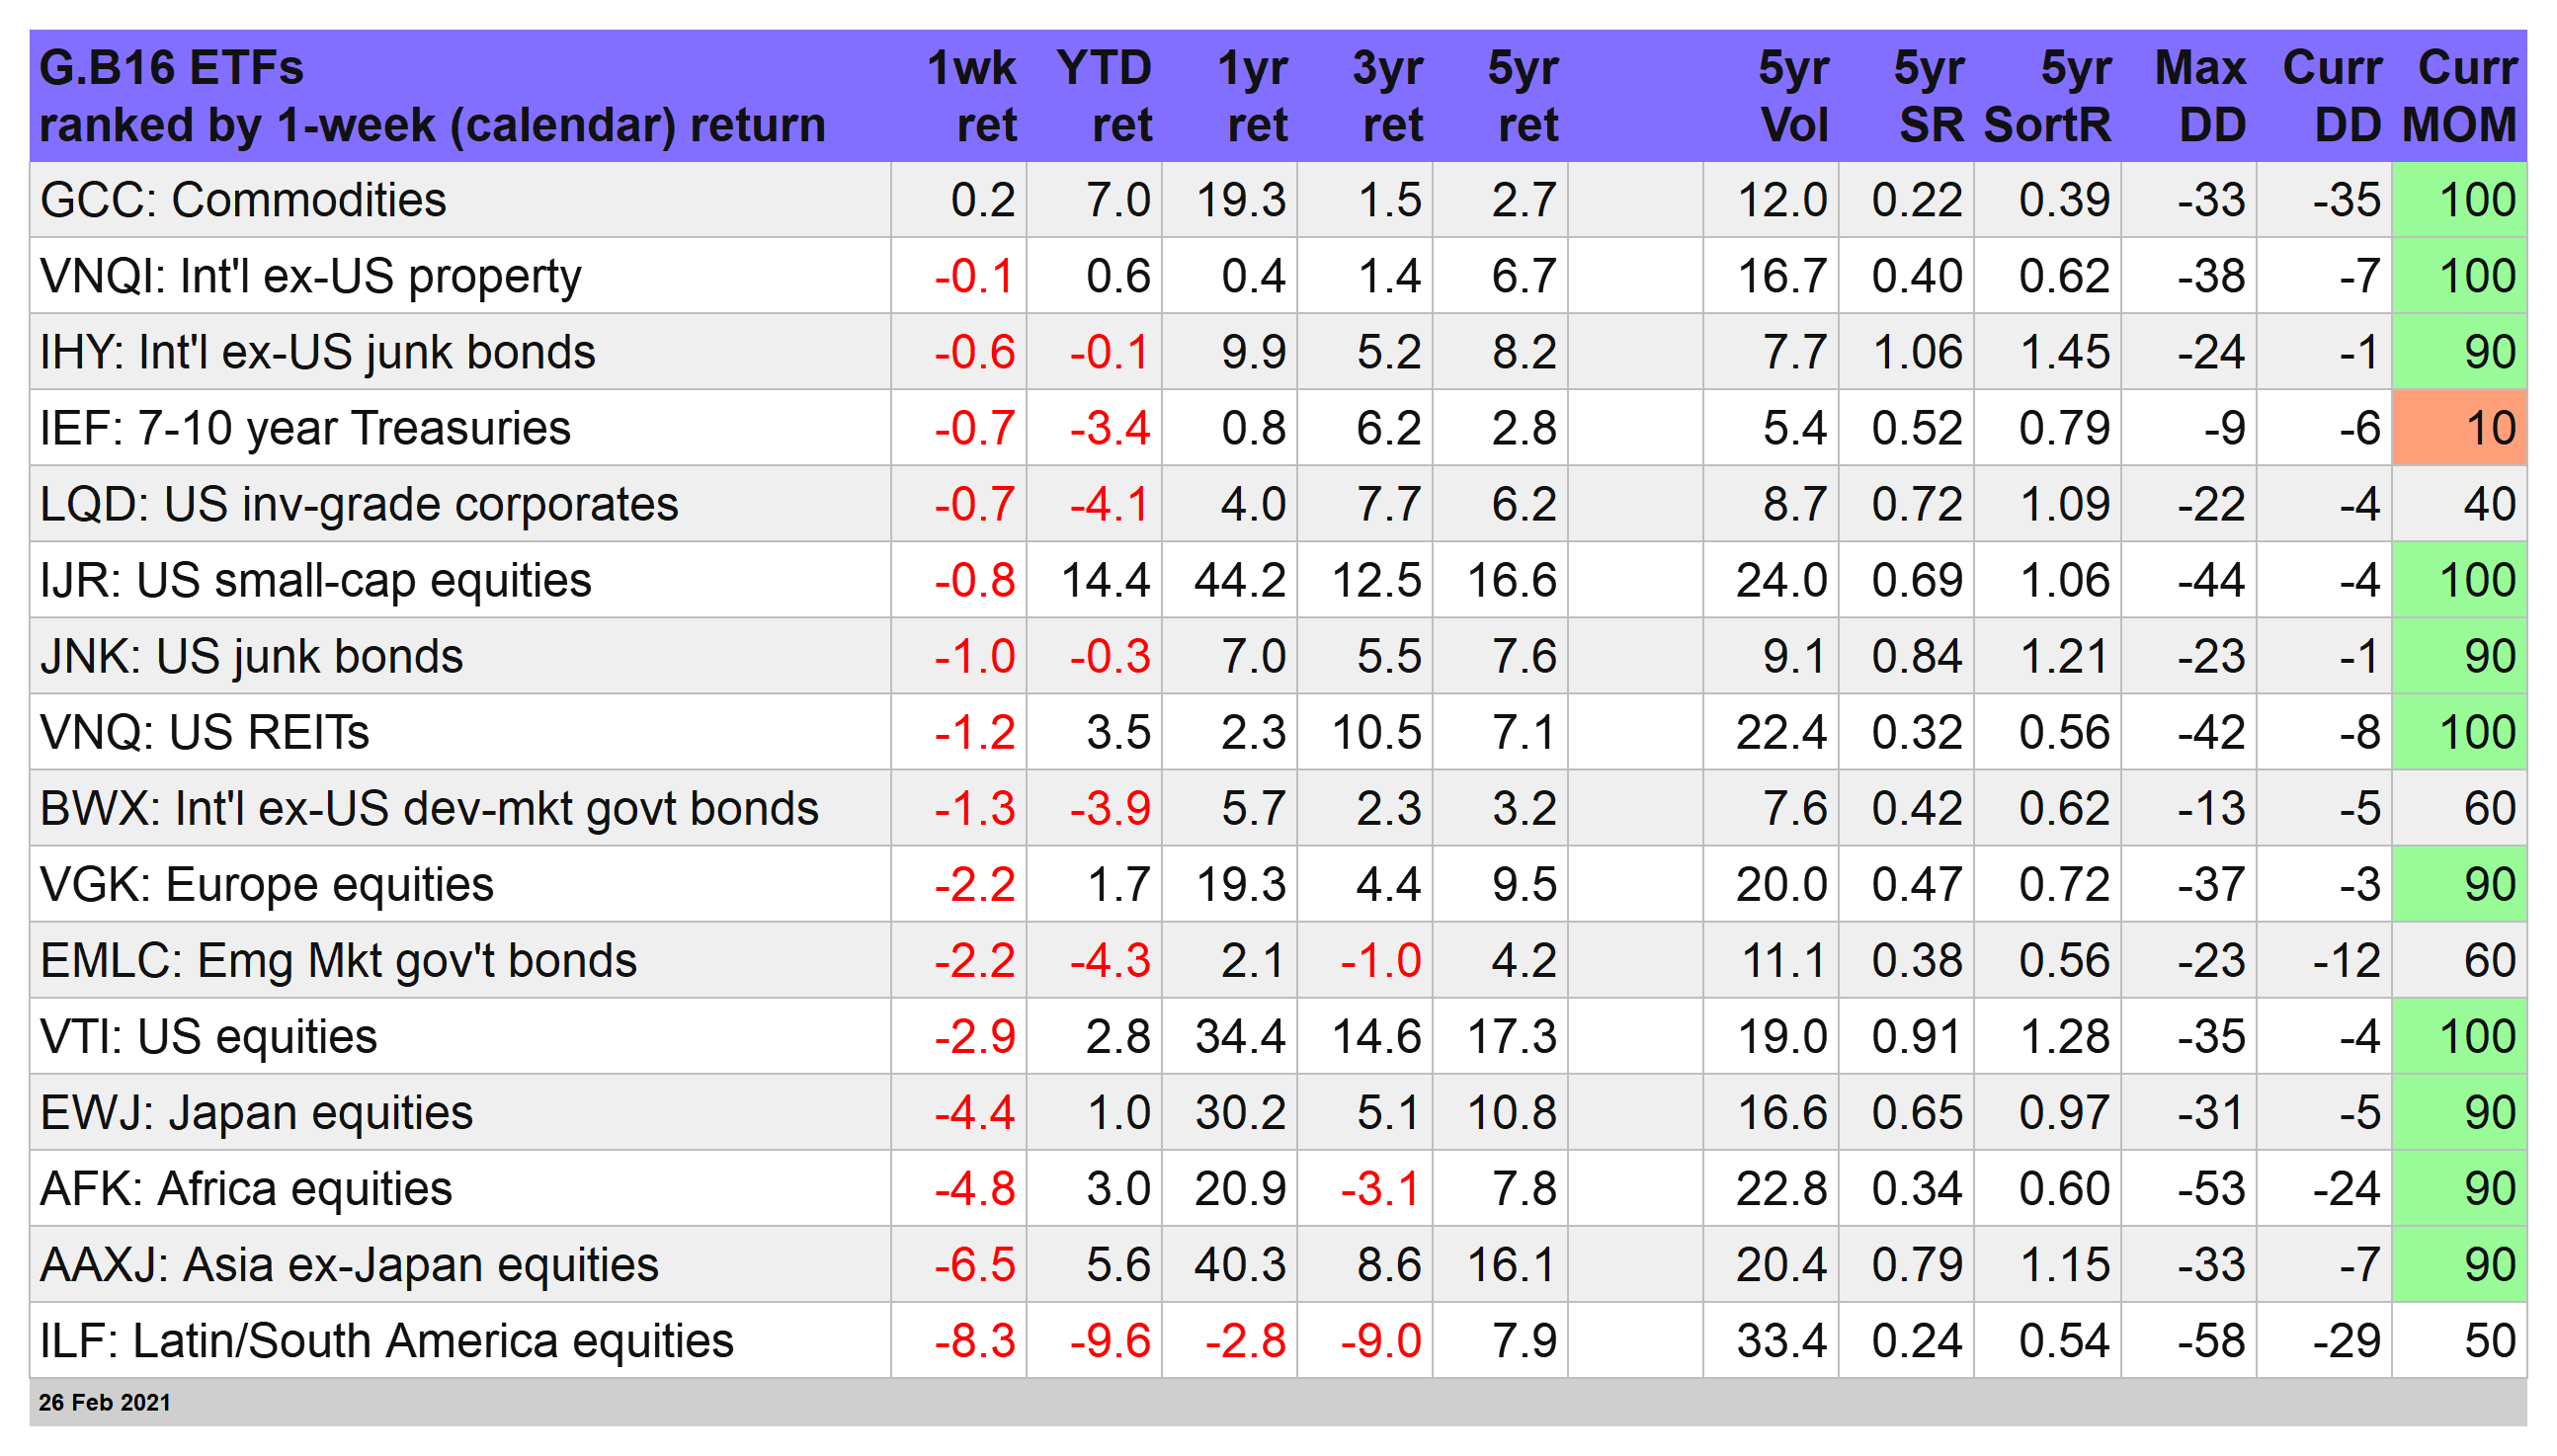
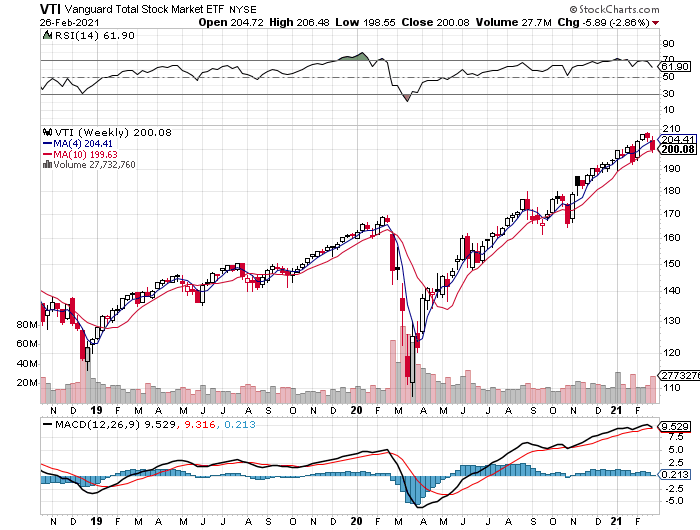
US stocks weren’t hit as hard as foreign shares. Vanguard Total US Stock Market Index Fund ETF Shares (NYSE:VTI) dropped 2.9%, the second straight weekly loss. The downturn of late for US shares has yet to reach the point that triggers a clear bear signal. Even after two weeks of selling, VTI’s momentum score is still 90, or just below the highest momentum ranking, per our proprietary ranking via the MOM column in the table above.
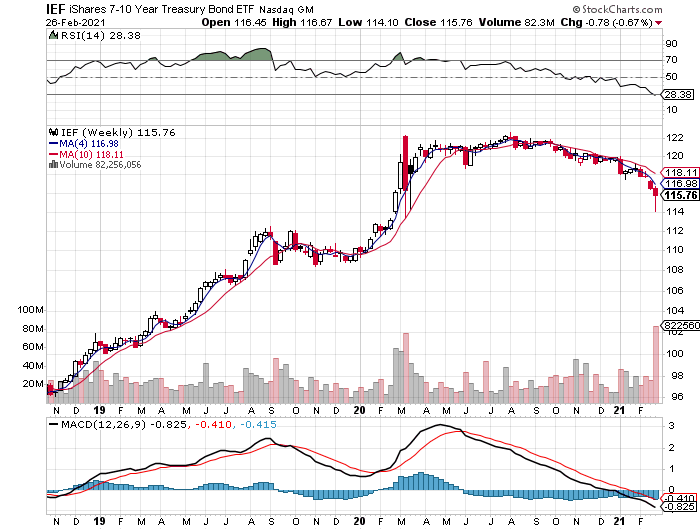
The US bond market, by contrast, is having a rough year. Consider intermediate Treasuries. Thanks to persistently rising interest rates for much of 2021 so far, iShares 7-10 Year Treasury Bond ETF (NYSE:IEF) has slumped over four straight weeks, giving up another 0.7% this week.
In fact, IEF’s troubles have been brewing since last September, when the fund showed early signs of reversing course after a strong rally in 2019 and through the first half of 2021. But the tide turned months ago and the slide is accelerating. IEF looks oversold for the immediate term, but the longer-run outlook remains bearish, per its MOM score of 10 (one notch above the lowest possible reading).
A second week of losses for portfolio benchmarks
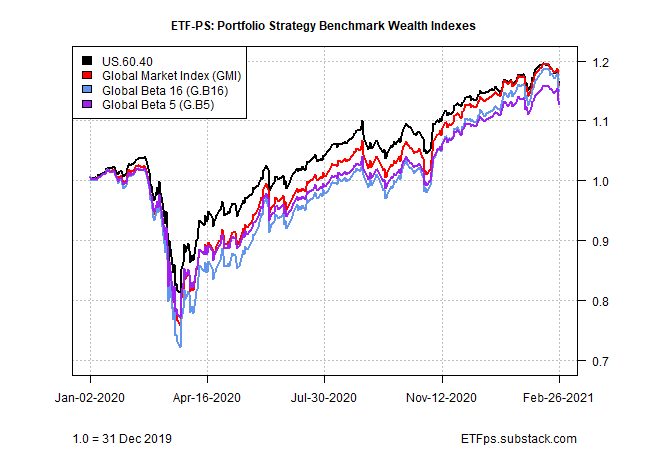
With almost no place to hide during last week’s selloff, all four of our strategy benchmarks fell sharply.
The biggest loss was posted by Global Beta 16 (G.B16), which represented the opportunity set for our proprietary strategies. G.B16 gave up 2.7% last week—a deeper follow-up to the previous week’s 0.6% decline.

Despite the back-to-back weekly losses, all four strategy benchmarks are still posting year-to-date gains, led by G.B16’s 2.1% advance in 2021 through Friday's close.
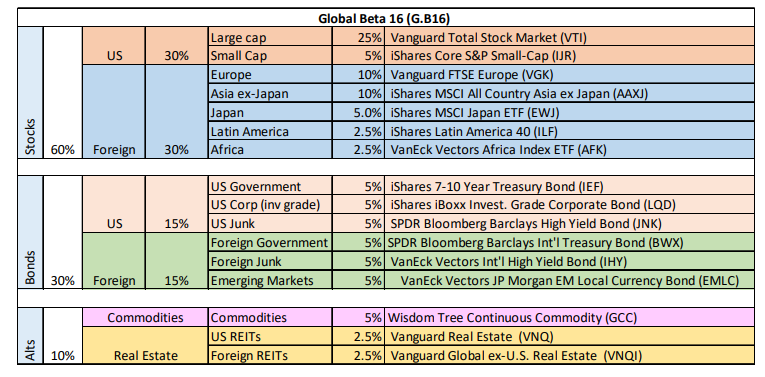
Momentum is turning for some of G.B. 16’s ETFs, but for the benchmark overall the recent selling has yet to dent its upside bias. The benchmark’s MOM score was nicked this week, but at 90 it remains just below 100—the highest bull reading.
Eyeballing recent history for the benchmarks suggests that the latest downturn is one more temporary correction. The question is whether inflation/interest rate worries will spoil the party this week and beyond?
The optimistic narrative is that the recent rise in interest rates is mostly a return to normal, which is to say a return to the pre-pandemic level of yields. By that reasoning, the rise in the 10-year Treasury yield still has a ways to go before regaining the heights prior to the coronavirus crisis.
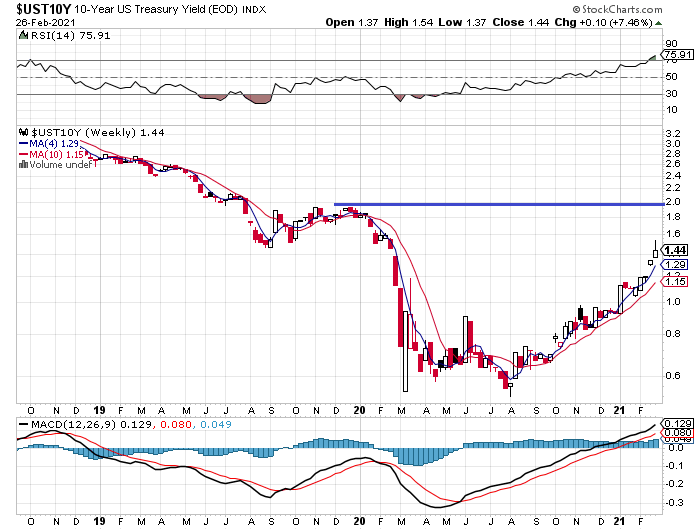
Consider that the 10-year rate was bumping up against the near -2.0% mark in early 2020 before crashing as COVID-19 roiled the economy. Returning to that mark translates into another 50-60 basis-point rise in the weeks or months ahead. That’s a modest increase from the current level. Then again, if recent history is a guide, the next 50-60 basis-point increase could witness some of the roughest terrain in global markets we’ve seen since, well, last year.
But that still leaves the elephant in the room. Let’s assume the 10-year rate jumps back to the ~2% neighborhood. Would that suffice to feed the beast? Or would inflation data at that point inspire even greater yield heights?
