Due to the extended bullish trend which has generally dominated the EUR/USD chart since last December, talk of a major bearish reversal might seem out of place. However, as the pair flirts with the important 1.15 handle, a relatively significant downturn may not be so far-fetched. Specifically, the ever-present bearish rectangle pattern is unlikely to yield just yet which should see the EUR scrambling for support.
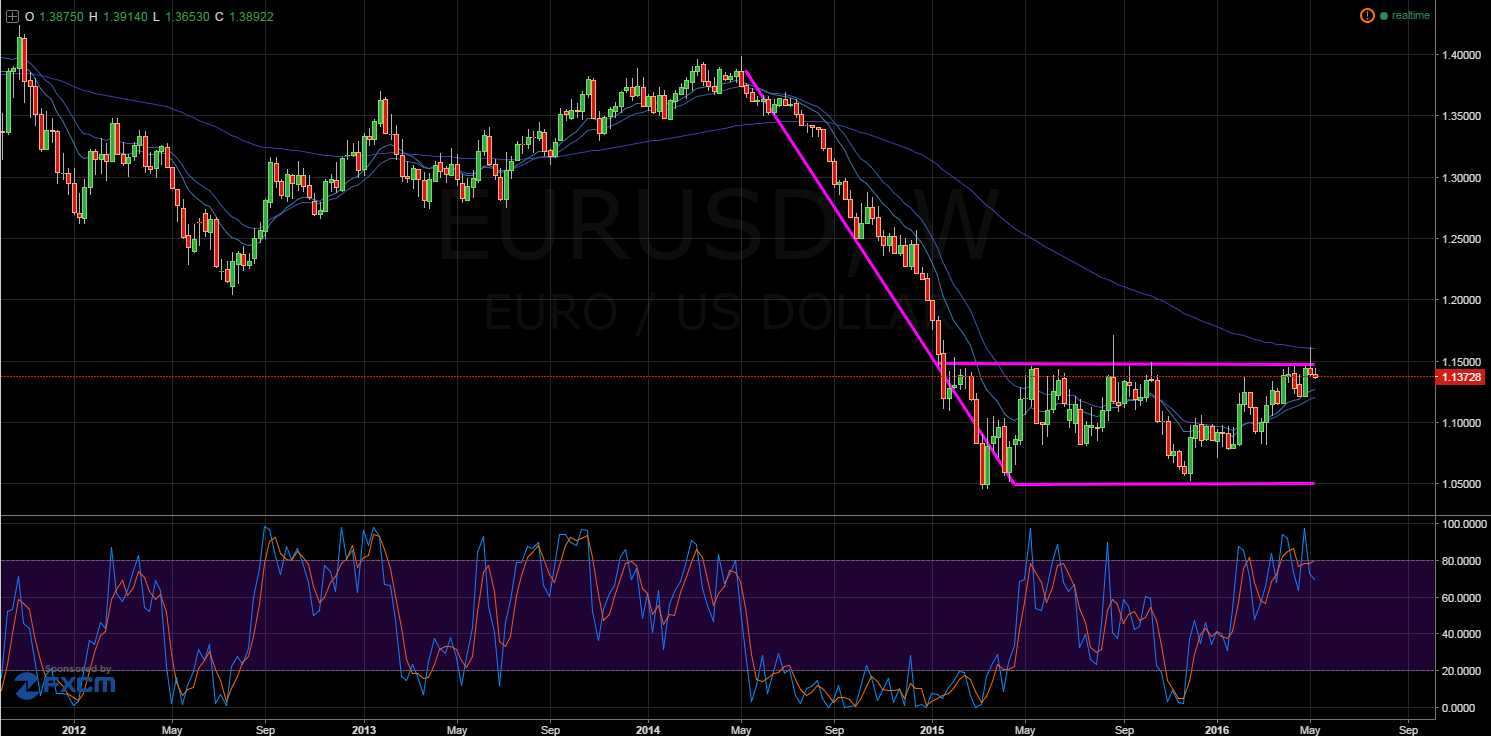
After a four month uptrend, it can be easy to forget that the EUR/USD has remained largely range bound between the 1.15 and 1.05 handles since April last year. During this ranging phase, the pair has tested the upside constraint of the bearish rectangle in multiple instances but to little effect. What’s more, the 100 week EMA is supplying additional dynamic resistance this time around which will make breaking the pattern that much more difficult.

As the 1.15 handle is unlikely to be broken, there remains little doubt that the pair should be heading lower once again. Whilst it would be a stretch to claim the next downwards movement might complete the bearish rectangle pattern with a downside breakout, the pair should at least move back to the 1.1213 support level. Looking at the weekly chart’s stochastic oscillator, it’s evident that the pair is overbought. Importantly, the overbought reading will be adding to the buying pressure being generated by the recent 0.8% contraction in the EU Industrial Production indicator result.
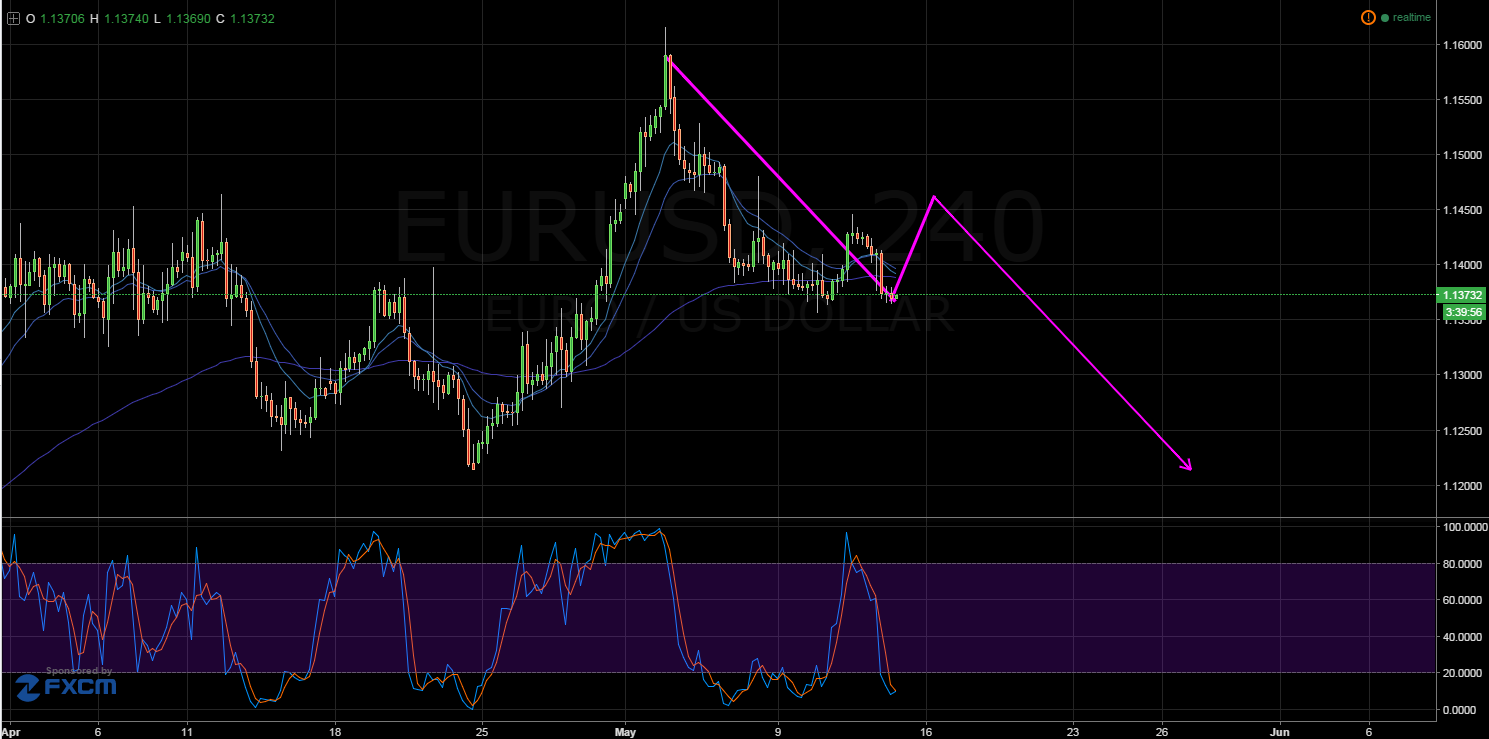
In addition, looking at a shorter time period shows how the downside correction is already beginning to take place. On the H4 chart, a potential ABCD corrective wave is mid-way to completion and is presently on the verge of retracing before its final leg. Unlike on the daily chart, the H4 stochastic oscillator is oversold and will be encouraging the retracement to take place. Consequently, the pair should pull back to the 1.1458 zone of resistance which has been tested many times before.

After the pullback, the EUR/USD should complete the corrective wave and tumble to at least 1.1211. This price represents not only a relatively equivalent slip to the A leg but also coincides with a well-tested zone of support. Whilst the fall to 1.1211 would be a significant correction to the downside, the pair could go lower still if a legitimate trend reversal occurs.
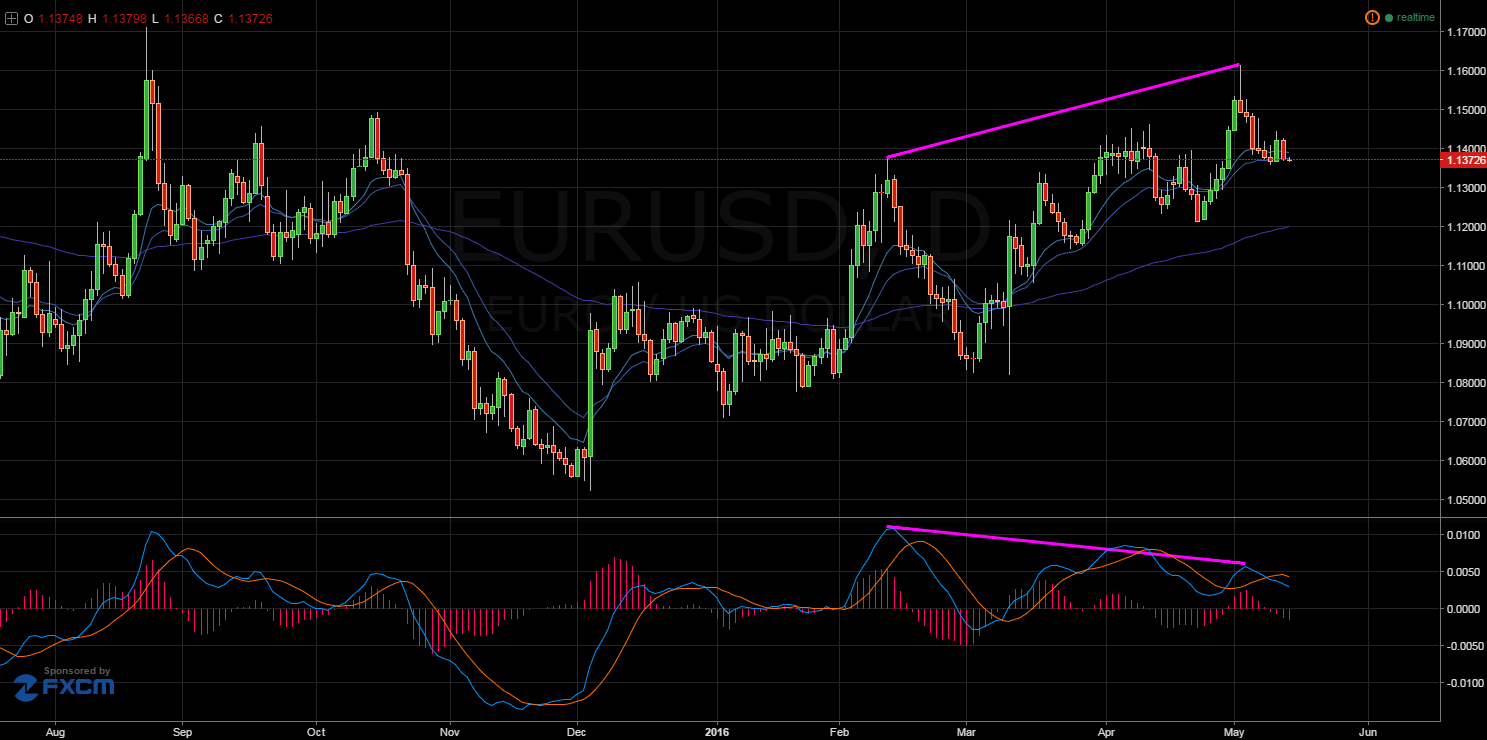
As evident on the daily chart, a relatively strong MACD divergence is revealing underlying weakness in the pair. As a result of this, the imminent tumble could extend losses beyond the 1.1211 support and see the EUR/USD trending back to the lower constraint of the bearish rectangle. Of course, we will have to wait for further confirmation before we can assess the likelihood of a more serious downtrend.

Ultimately, whilst it is uncertain how low the EUR/USD will travel, it is relatively likely that the downside potential of this pair will be realised in the near future. Specifically, the long term chart patterns and the short term technicals are seemingly in agreement, the recent bullish trend is losing momentum. As a result, the EU GDP results will be in focus as the week comes to a close as they could set the tone for the coming week.
