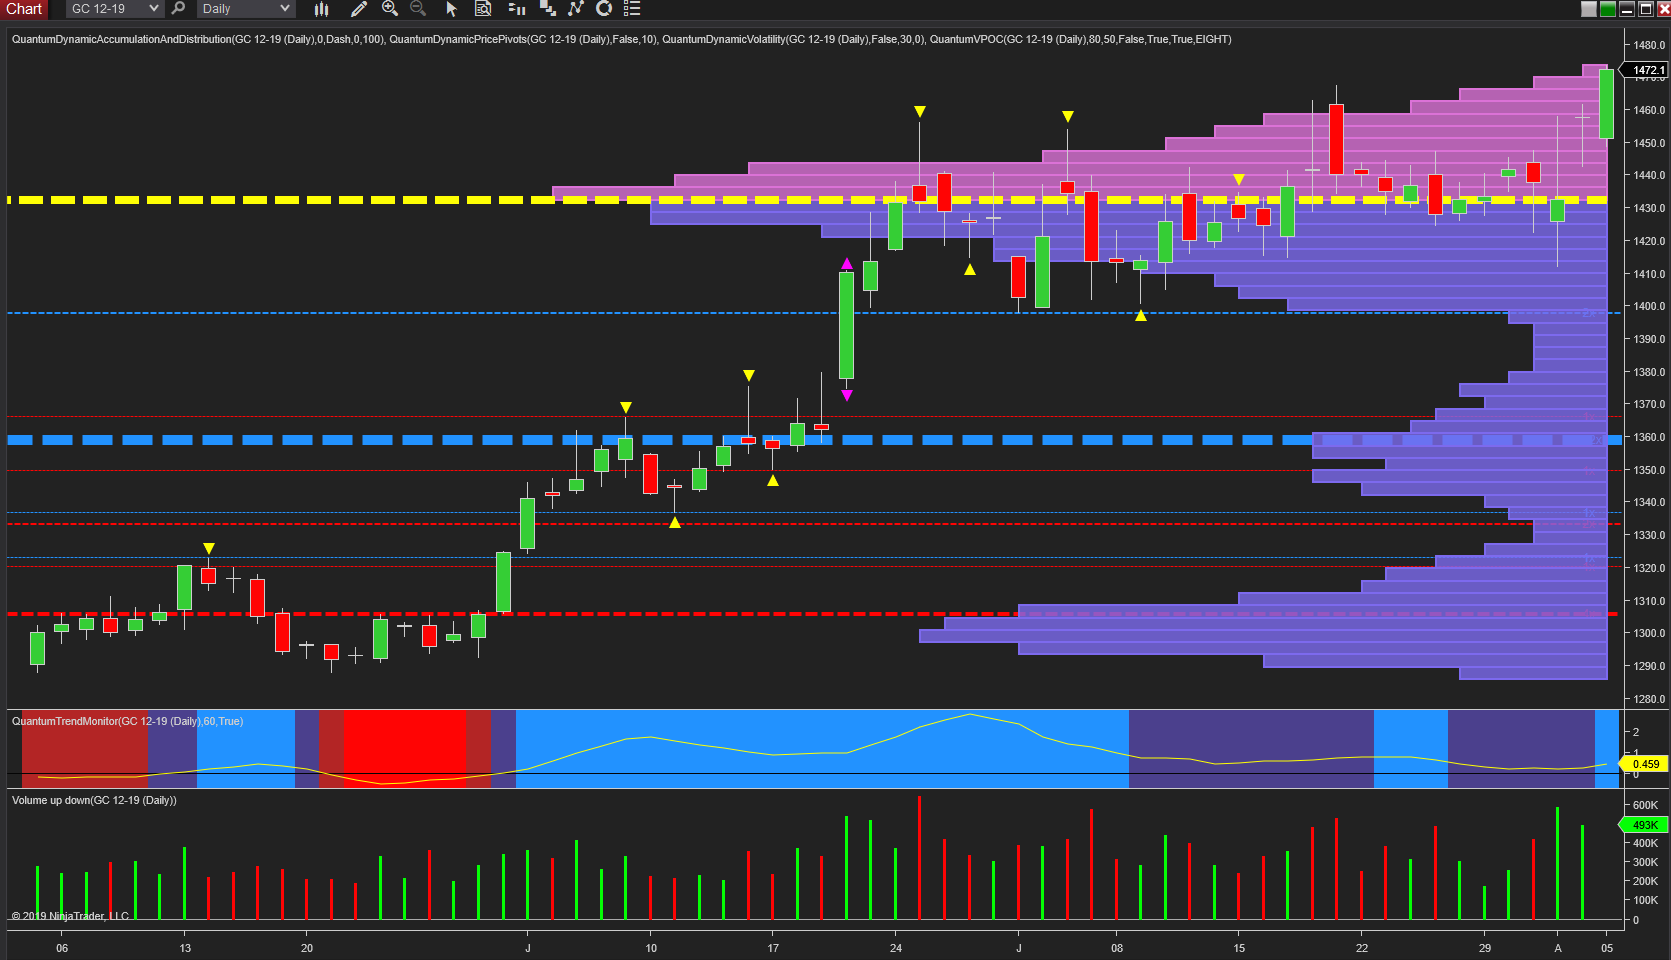
Over recent years there have been seminals phases of price action on the gold chart, which then dictate the longer-term outlook for the precious metal, and today may well be the start of another of these periods as gold attempts to break away from the volume point of control denoted with the yellow dashed line and anchored at $1432 per ounce on the daily chart.
The drivers for gold are many and varied including inflation, the US dollar and safe-haven flows, and it is the last of these which has given the metal a boost in early trading at the start of another trading week, albeit one deep in summer. Overnight and ahead of the US open, gold has surged higher as risk-on appetite evaporates as fast as the morning dew, with Asian and European markets falling following the escalation in trade tensions between the US and China, with both the Japanese yen and the gold benefitting from risk flows.
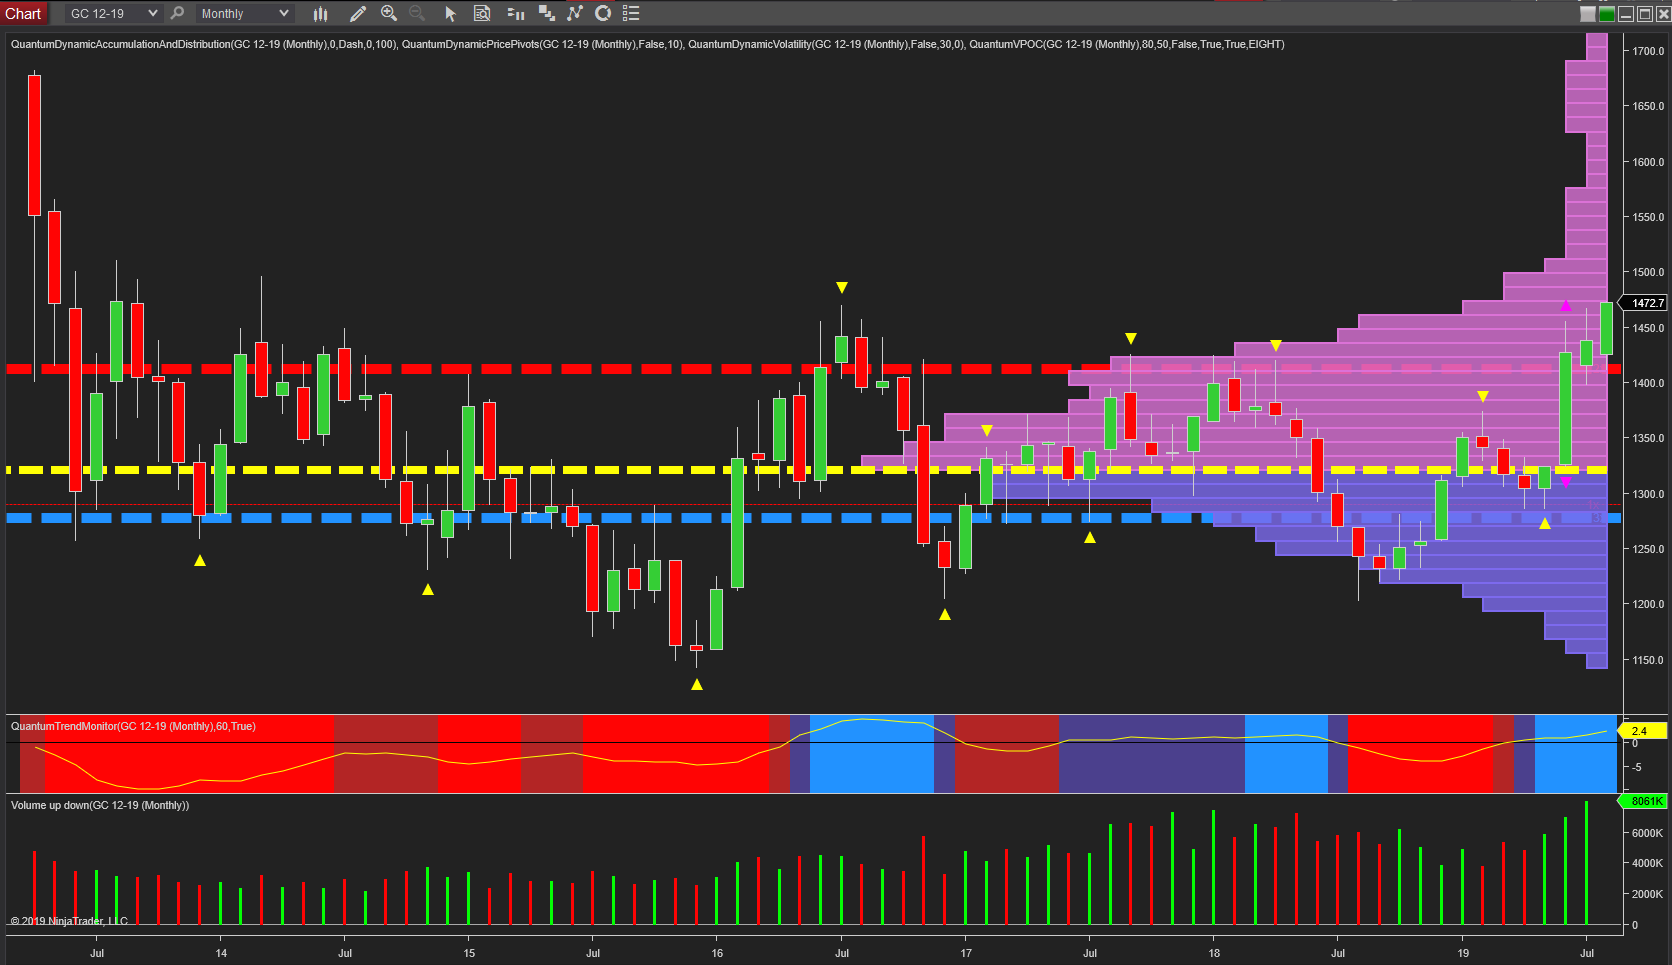
For gold, this has propelled the metal firmly through the resistance which had been building in the $1460 per ounce area, to currently trade at $1470.90 per ounce at time of writing, and provided today’s candle remains solid and green with good volume we are likely to witness a sustained move higher for the precious metal in the longer term. Immediately ahead is a low volume node which will help gold progress higher, and to identify the next target in the bullish trend we need to consider the monthly chart.

And here too are encouraging signs for gold bugs. First, we have a rising market with rising volume, which is always a good sign as it confirms the big operators are supporting the move higher. Second, the strong resistance denoted with the red dashed line at $1420 per ounce on the accumulation and distribution indicator has now been taken out, and so provides an excellent springboard for the development of the trend. Third, here again as with the daily chart, we have an extended low volume node ahead from $1500 per ounce through to $1700 per ounce which is excellent news. Finally, notice the trend monitor which is bright blue and confirming the positive sentiment for gold in this timeframe and supported by the yellow trend line with is rising gently.
Altogether many reasons gold bugs for gold bugs to be happy today, and should we see the dollar weaken, this too will provide further help to the precious metal.
