The Advance Retail Sales Report released yesterday shows that sales in October came in at 0.4% month-over-month and 3.9% year-over-year.
Now let's dig a bit deeper into the "real" data, adjusted for inflation and against the backdrop of our growing population.
The first chart shows the complete series from 1992, when the U.S. Census Bureau began tracking the data in its current format. I've highlighted recessions and the approximate range of two major economic episodes.
The Tech Crash that began in the spring of 2000 had relatively little impact on consumption. The Financial Crisis of 2008 has had a major impact. After the cliff-dive of the Great Recession, the recovery in retail sales has taken us (in nominal terms) 12.2% above the November 2007 pre-recession peak.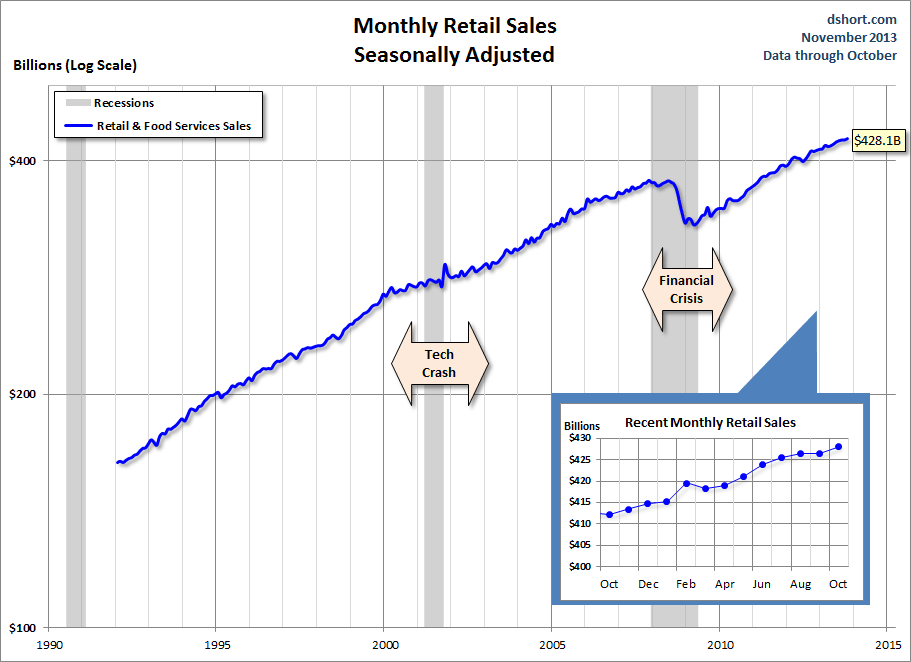
Here is the same chart with two trendlines added. These are linear regressions computed with the Excel Growth function.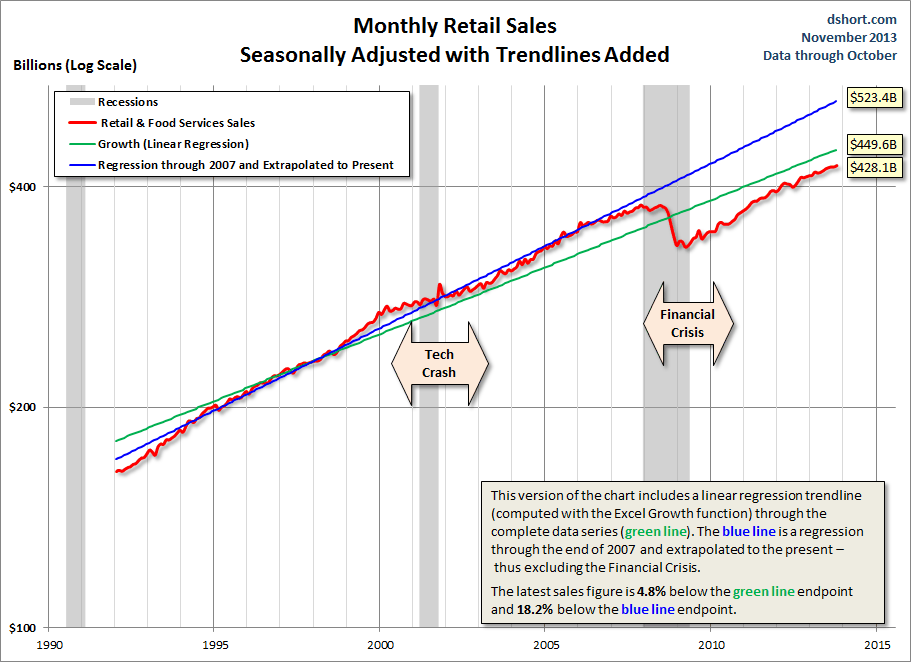
The green trendline is a regression through the entire data series. The latest sales figure is 4.8% below the green line end point.
The blue line is a regression through the end of 2007 and extrapolated to the present. Thus, the blue line excludes the impact of the Financial Crisis. The latest sales figure is 18.2% below the blue line end point.
We normally evaluate monthly data in nominal terms on a month-over-month or year-over-year basis. On the other hand, a snapshot of the larger historical context illustrates the devastating impact of the Financial Crisis on the U.S. economy.
The "Real" Retail Story: The Consumer Economy Remains at a Recessionary Level
How much insight into the US economy does the nominal retail sales report offer? The next chart gives us a perspective on the extent to which this indicator is skewed by inflation and population growth. The nominal sales number shows a cumulative growth of 160.9% since the beginning of this series. Adjust for population growth and the cumulative number drops to 110.0%. And when we adjust for both population growth and inflation, retail sales are up only 24.2% over the past two decades.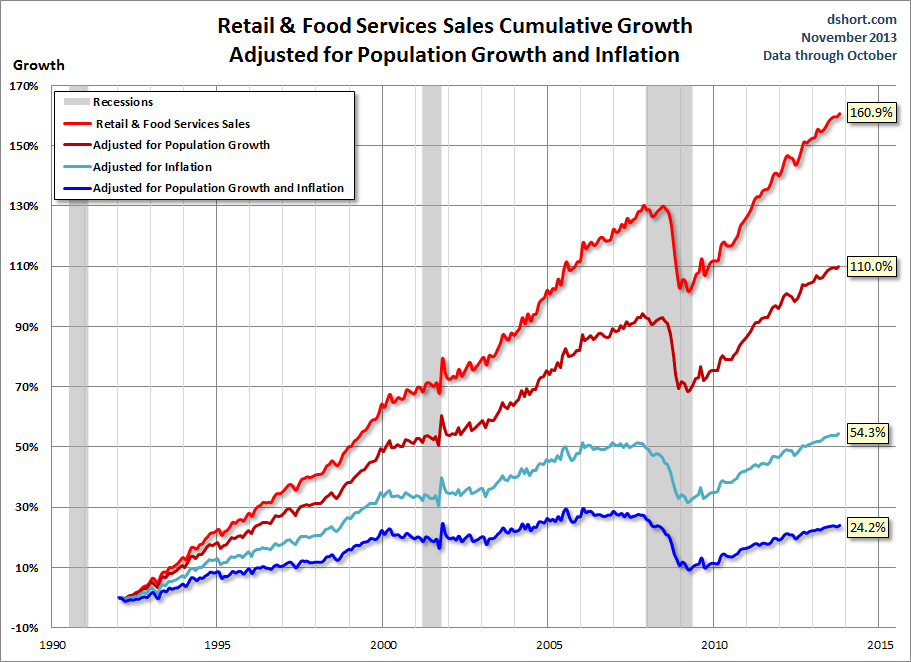
Let's continue in the same vein. The charts below give us a rather different view of the U.S. retail economy and the long-term behavior of the consumer. The sales numbers are adjusted for population growth and inflation. For the population data I've used the Bureau of Economic Analysis mid-month series available from the St. Louis FRED with a linear extrapolation for the latest month. Inflation is based on the latest Consumer Price Index. I've used the seasonally adjusted CPI as a best match for the seasonally adjusted retail sales data. October retail sales with the dual adjustment came in at 0.4% month-over-month, the same as the unadjusted MoM (thanks to a disinflationary CPI that offset the estimated population growth). However the adjusted data rose only 2.2% year-over-year, much lower than the 3.9% YoY reported in the popular financial press.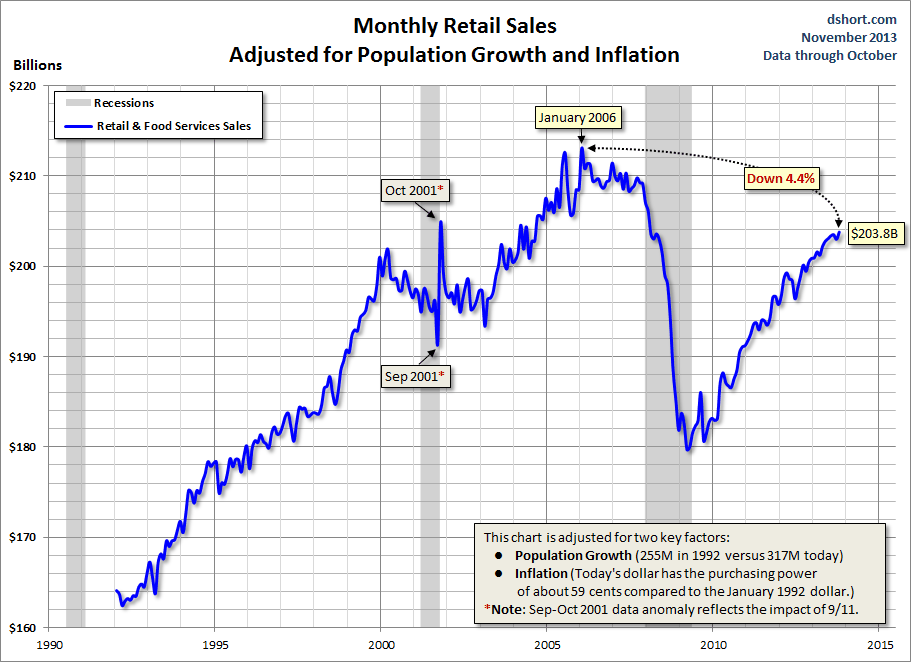
Consider: Since January 1992, the U.S. population has grown about 24% while the dollar has lost about 41% of its purchasing power to inflation. Retail sales have been recovering since the trough in 2009. But the "real" consumer economy, adjusted for population growth is still in recession territory — 4.4% below its all-time high in January 2006.
As I mentioned at the outset, month-over-month retail sales were up 0.4%. However, gasoline prices can act as a tax on economic growth: The more we spend on gasoline, the less we have to spend on other goods. Conversely, when gas prices fall, there's more money for other purchases. With this concept in mind, let's look at the real, population-adjusted retail sales excluding gasoline.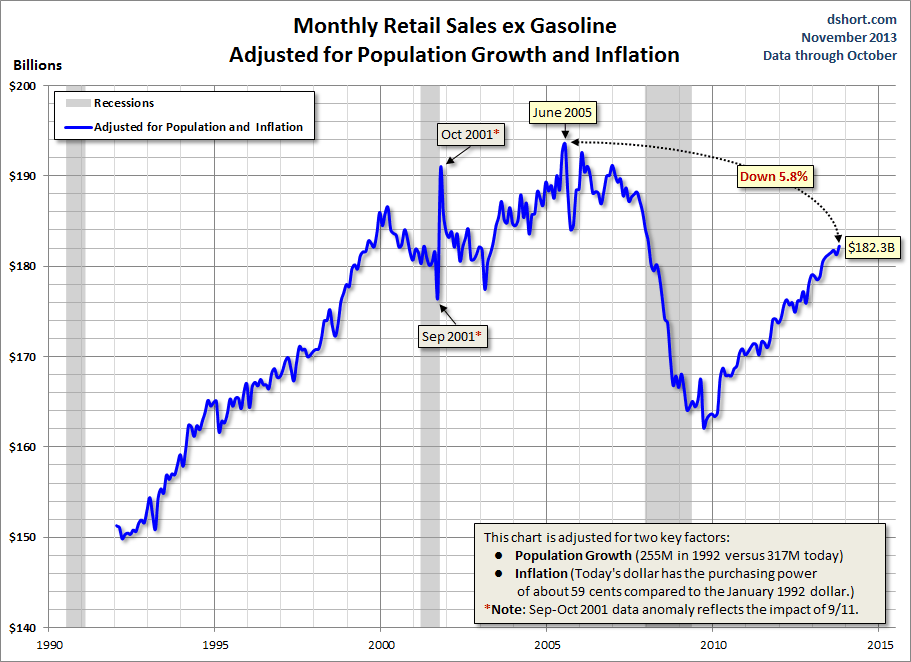
By this analysis, thanks to falling gasoline prices, adjusted retail sales ex gasoline was 0.5% in October from the previous month and up 5.3% year-over-year. However, it's down 5.8% from its all-time high in June 2005.
The Great Recession of the Financial Crisis is behind us, a close analysis of the adjusted data suggests that the recovery has been frustratingly slow. The sobering reality is that, in "real" terms — adjusted for population growth and inflation — consumer sales remain at the level we saw about three months into the last recession.
- English (UK)
- English (India)
- English (Canada)
- English (Australia)
- English (South Africa)
- English (Philippines)
- English (Nigeria)
- Deutsch
- Español (España)
- Español (México)
- Français
- Italiano
- Nederlands
- Polski
- Português (Portugal)
- Português (Brasil)
- Русский
- Türkçe
- العربية
- Ελληνικά
- Svenska
- Suomi
- עברית
- 日本語
- 한국어
- 简体中文
- 繁體中文
- Bahasa Indonesia
- Bahasa Melayu
- ไทย
- Tiếng Việt
- हिंदी
Real Retail Sales Per Capita: Another Perspective On The Economy
Published 11/21/2013, 01:50 AM
Real Retail Sales Per Capita: Another Perspective On The Economy
Latest comments
Loading next article…
Install Our App
Risk Disclosure: Trading in financial instruments and/or cryptocurrencies involves high risks including the risk of losing some, or all, of your investment amount, and may not be suitable for all investors. Prices of cryptocurrencies are extremely volatile and may be affected by external factors such as financial, regulatory or political events. Trading on margin increases the financial risks.
Before deciding to trade in financial instrument or cryptocurrencies you should be fully informed of the risks and costs associated with trading the financial markets, carefully consider your investment objectives, level of experience, and risk appetite, and seek professional advice where needed.
Fusion Media would like to remind you that the data contained in this website is not necessarily real-time nor accurate. The data and prices on the website are not necessarily provided by any market or exchange, but may be provided by market makers, and so prices may not be accurate and may differ from the actual price at any given market, meaning prices are indicative and not appropriate for trading purposes. Fusion Media and any provider of the data contained in this website will not accept liability for any loss or damage as a result of your trading, or your reliance on the information contained within this website.
It is prohibited to use, store, reproduce, display, modify, transmit or distribute the data contained in this website without the explicit prior written permission of Fusion Media and/or the data provider. All intellectual property rights are reserved by the providers and/or the exchange providing the data contained in this website.
Fusion Media may be compensated by the advertisers that appear on the website, based on your interaction with the advertisements or advertisers.
© 2007-2025 - Fusion Media Limited. All Rights Reserved.
