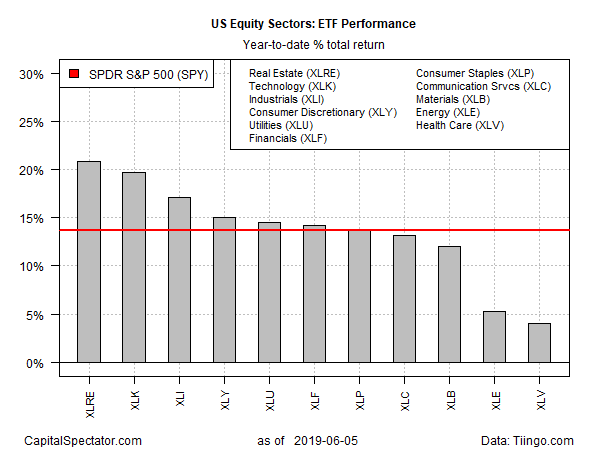
The US stock market has been on a roller coaster this year, but the volatility hasn’t dented the relatively smooth bull market in securitized real estate shares. In the wake of the tech sector’s slide in recent weeks, real estate investment trusts (REITs) have become the top-performing US equity sector year to date, based on a set of exchange-traded funds.
Real Estate Select Sector SPDR (NYSE:XLRE) is up 20.8% so far in 2019 through yesterday’s close (June 5). After yesterday’s sharp gain, the ETF closed at a record high, securing its position as this year’s performance leader for the main US equity sectors.

Technology shares had been on top for much of the year until the sector suffered a reversal of fortunes that began in early May. The near-continuous slide in Technology Select Sector SPDR (NYSE:XLK) reduced the formerly high-flying ETF to second-place status in recent days.
XLK’s demotion in this year’s sector horse race is conspicuous but it’s premature to give up on this slice of the US equity market as a performance leader. Indeed, XLK’s 19.7% year-to-date gain is only slightly behind XLRE’s front-runner results for 2019.
Meanwhile, it’s notable that the volatility in stocks generally in 2019 has yet to push any US sector into the red on a year-to-date basis. The weakest performer remains modestly up for the year so far: Health Care Select Sector SPDR (NYSE:XLV) has increased 4.0% through yesterday’s close, on a total-return basis.
For the market overall, the year-to-date results remain impressive. SPDR S&P 500 (NYSE:SPY) is ahead 13.7% in 2019.
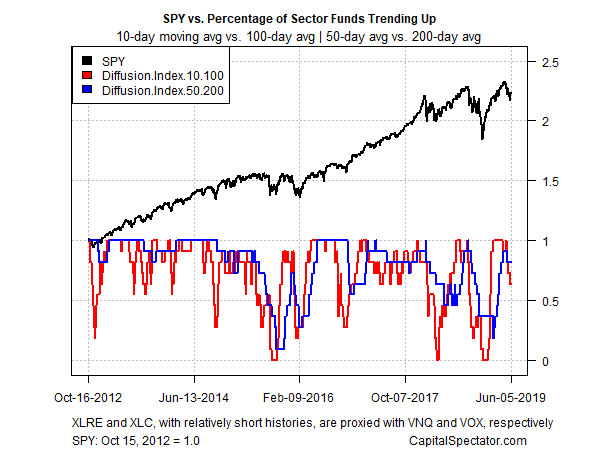
Despite the solid across-the-board returns for sectors, it appears that the bullish momentum tide has peaked recently, based on a pair of moving averages. The first of the pair compares the 10-day moving with the 100-day average, a measure of short-term trending behavior (red line in chart below). A second set of moving averages (50 and 200 days) offers an intermediate measure of the trend (blue line). The indexes range from 0 (all funds trending down) to 1.0 (all funds trending up).

Using prices through yesterday reminds that the strong upside momentum has given way to a mixed profile for equity sectors. Indeed, the short-term momentum index (red line) has fallen below the intermediate trend index (blue) for the first time since early February. The downturn suggests there’s more uncertainty (relatively to recent history) for guesstimating the near-term outlook for the sector ETFs generally.
