Even if you are not a fundamental trader and only spend a few minutes/hours a day in the front of your trading platform, you could not miss the turmoils that shudder the world. Only in the first half of 2014 we had a coup in Thailand, civil strife and partial dismemberment in Ukraine, turmoils in Egypt and Syria, escalation of violence in Iraq - and the most recent ones - the civil airplane shot down over Ukraine and the Israel ground offensive in Gaza.
In a normal market, these events would have pushed investors to be cautios, not only limiting the tops in the equity markets but even driving them into a 10%-15% correction. None of the events I listed above had this effect. Not even a mix of those turmoils scared the investors and this is becoming a little oppressive.
The civil strife in Ukraine is far by being ended and the Israel – Gaza conflict could turn from a neighborhood feud into a global conflict, and still, the world benchmark equity index is trading near all times record highs.
There would be one more thing to add: the BRICS is planning to become a “political alliance” to reform the International Financial System. By reform they mean to turn against the US Dollar hegemony. These talks about Russia and China working hard to “destroy” the USD hegemony are old and only intensifying in the last few months. I have to admit that I find it remarkable that the Fed and US policy makers are not worried in any way about this, and they are not doing or saying anything regarding this issue.
The reason I brought the BRICS issue into my article is because I’m trying to emphasize something here: the only music that the investors are willing to dance on, is the Fed’s music. They don’t seem to price a lot the geopolitical risks in Ukraine or in the Middle East and for sure they don’t believe in a BRICS’ victory in taking down the USD. In my opinion, what BRICS can do is to sign an agreement that between them can accept payments in other currency than USD and they might have some other countries joining them but that’s it and is not enough. BRICS is only Brazil, Russia, India, China and South Africa: 5 countries. The commercial exchanges between the BRICS group and the rest of the world will still be made in USD.
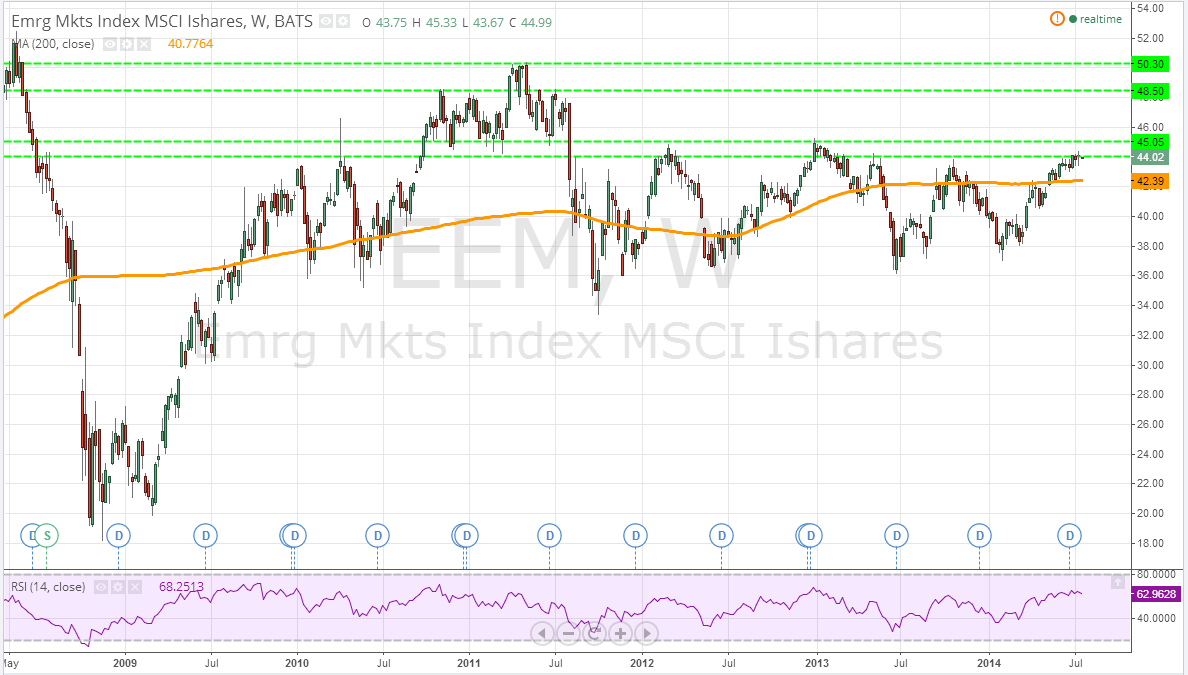
In other words, the Fed is playing the music and the USD will remain the king of the prom. But, just in case the investors will start to care about what’s hapenning outside the Fed’s doors, the first place you should look at, are the Emerging Markets. The iShares MSCI Emerging Markets (ARCA:EEM) – is an ETF that seeks to track the investment results of an index composed of large and mid-capitalization emerging market equities – is trading at an important resistance area, as you can see on my weekly chart. 
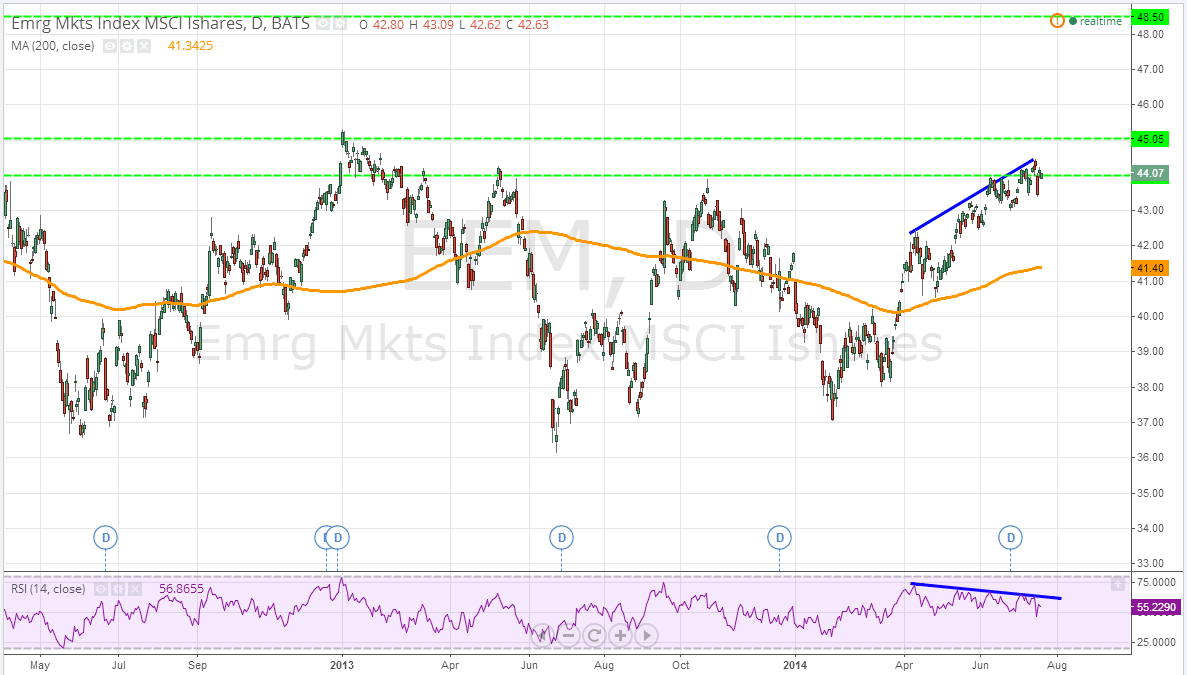
What’s interesting about this ETF is that is building a strong divergence with the RSI on the daily chart, which started back in April and I don’t think there will be much to wait till the investors will pull some money out of the EM. 
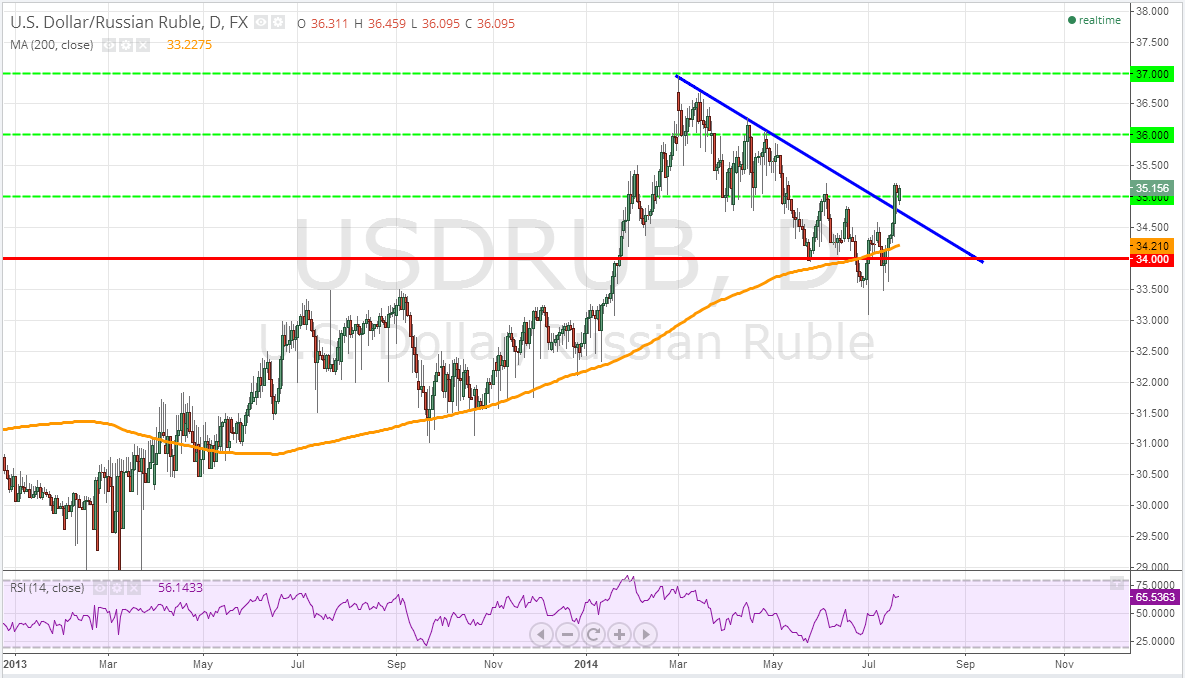
If you only trade Forex, you should monitor TRY (Turkey is the closest important EM to the Middle East tensions and the first to be dumped if the things will get really hairy there) and look to buy a dip in USD/TRY. The RUB is already under huge pressure and the new situation with the civil airplane crushing on the border with Ukraine are maintaining the risks in USD/RUB to the upside. The first two key resistance areas are at 36.00 and 37.00. 
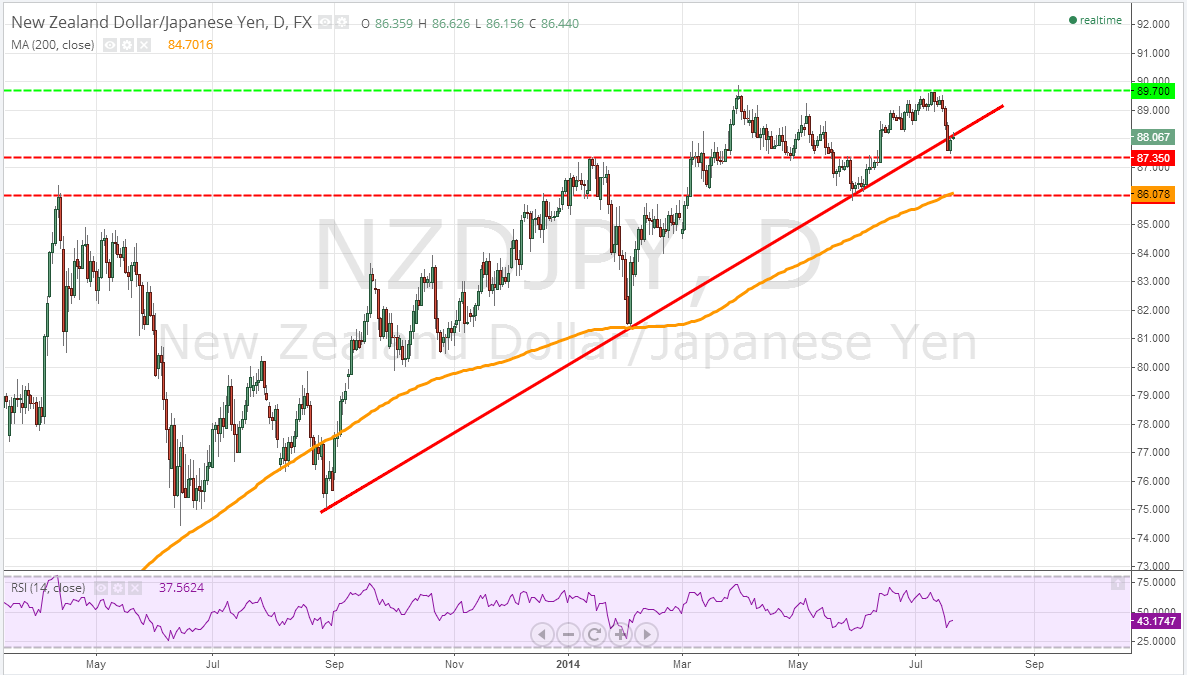
The second place I would look at, are the high yield currencies as NZD and AUD. If you don’t like the USD (I know many traders are dissapointed of how USD acted this year) the best way to profit from a sell off in the stock market due to a change in the investor’s perspective about the geopolitical risks, is to sell NZD and AUD against safe havens as JPY and CHF. Speaking of NZD/JPY, I noted that this pair on the daily chart closed under an ascending tend line, for the first time in 12 months – since this strong bullish trend started. It failed to make a new high, formed a double top and last week closed for the very first time under that rising trend line. The first support is at 87.35 but the key support is at 86.00 as there is a confluence with an ex-resistance area and the 200 SMA. 
Trading the geopolitics events is not easy and in the current market conditions is as twice as difficult, but the bottom line is that being a trader, you can make money trading these events. One of my favourite trading theories - the Dow Theory - says that the market discounts all news as soon as they become available. Even if you are an intra-day trader, jumping into a trade as soon as an important news was released could bring you much more money than waiting for the eur/usd (or any other major currency pair) to break an important support/resistance area so that you can take advantage of it. Hopefully, once the Fed will start raising the rates, we will turn back into a normal market, when such events as we have in the Middle East or Ukraine, will bring some volatility and some clear reactions in the market.
- English (UK)
- English (India)
- English (Canada)
- English (Australia)
- English (South Africa)
- English (Philippines)
- English (Nigeria)
- Deutsch
- Español (España)
- Español (México)
- Français
- Italiano
- Nederlands
- Português (Portugal)
- Polski
- Português (Brasil)
- Русский
- Türkçe
- العربية
- Ελληνικά
- Svenska
- Suomi
- עברית
- 日本語
- 한국어
- 简体中文
- 繁體中文
- Bahasa Indonesia
- Bahasa Melayu
- ไทย
- Tiếng Việt
- हिंदी
Ready To Trade Outside The Fed's Door, Where To Look First?
Published 07/21/2014, 12:45 PM
Ready To Trade Outside The Fed's Door, Where To Look First?
Latest comments
Loading next article…
Install Our App
Risk Disclosure: Trading in financial instruments and/or cryptocurrencies involves high risks including the risk of losing some, or all, of your investment amount, and may not be suitable for all investors. Prices of cryptocurrencies are extremely volatile and may be affected by external factors such as financial, regulatory or political events. Trading on margin increases the financial risks.
Before deciding to trade in financial instrument or cryptocurrencies you should be fully informed of the risks and costs associated with trading the financial markets, carefully consider your investment objectives, level of experience, and risk appetite, and seek professional advice where needed.
Fusion Media would like to remind you that the data contained in this website is not necessarily real-time nor accurate. The data and prices on the website are not necessarily provided by any market or exchange, but may be provided by market makers, and so prices may not be accurate and may differ from the actual price at any given market, meaning prices are indicative and not appropriate for trading purposes. Fusion Media and any provider of the data contained in this website will not accept liability for any loss or damage as a result of your trading, or your reliance on the information contained within this website.
It is prohibited to use, store, reproduce, display, modify, transmit or distribute the data contained in this website without the explicit prior written permission of Fusion Media and/or the data provider. All intellectual property rights are reserved by the providers and/or the exchange providing the data contained in this website.
Fusion Media may be compensated by the advertisers that appear on the website, based on your interaction with the advertisements or advertisers.
© 2007-2025 - Fusion Media Limited. All Rights Reserved.
