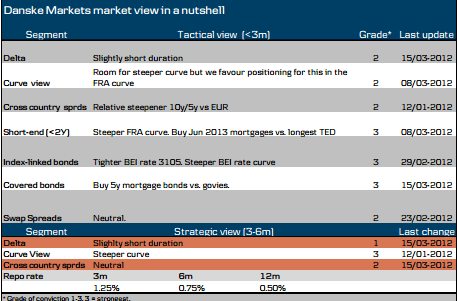
We take a look at allocations in a Swedish bond portfolio and recommend overweighting longer covered bonds, thus going further out on the curve.
Short covered bonds have performed well since the start of the year, time for a pause. The risk to supply has diminished quite substantially since it has become much cheaper for mortgage institutions to issue on the EUR covered bond market.
Extensions along the covered bond curve versus matched forward starting swaps look attractive.
Buy SWH185 versus SGB1051 @ 153.5bp.
Profit taken, we collect profit in the 2y spread SWH166/SGB1041. Profit +14bp. We suggest moving further out on the curve instead, see above.
Loss taken, we take loss in the long position in 2y covered bonds outright. Loss -6bp. We keep our hedge (pay) FRAJUN12 for the time being, but recommend decreasing risk.
Time to overweight longer mortgage bonds in the portfolio
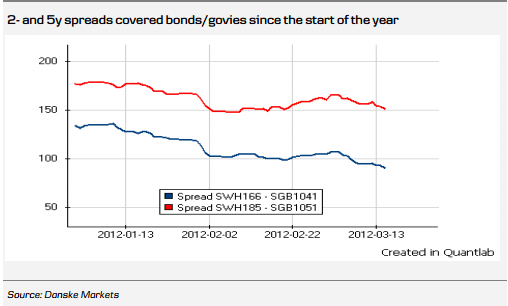
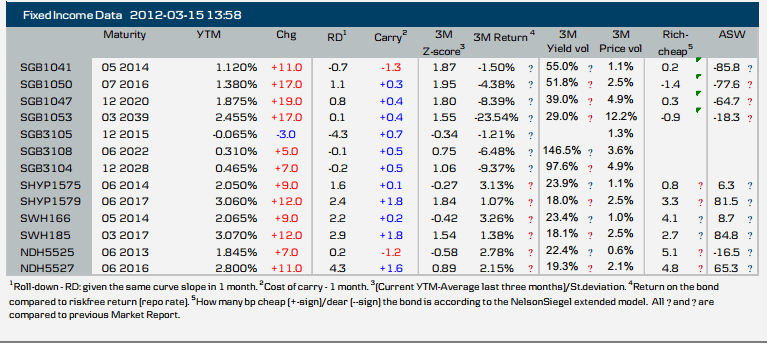
During the start of the year we have recommended being long short mortgage bonds relative to government bonds. We argued that upcoming rate cuts, which would keep down fixings, and the fact that there was little value left in short government bonds would translate in covered bond outperformance. It has so far been a pleasant journey being long short-dated covered bonds relative to government bonds. For instance SHW166 has provided an annualized return of +0.74%, whereas the matching government bond, SGB1041, has returned -0.30%. Honestly, however, longer mortgage bonds have outperformed government bonds even more but the return in longer mortgage bonds has outperformed government bonds even more but the return in longer mortgage bonds has been more or less the same as in shorter ones, despite lower risk. In terms of spreads relative to government bonds, shorter bonds have in any case been a better alternative.
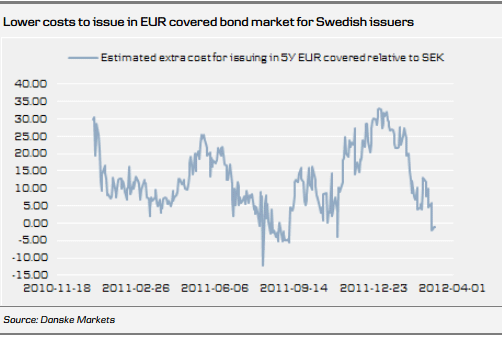
 Risks associated with supply of covered bonds are more important in longer durations as most of the issuance is tilted towards the 5y point. During the beginning of the year there was a risk that the higher CCS level would prevent Swedish mortgage institutions from funding themselves in EUR due to the high relative cost. Now the CCS spread has tightened significantly and Swedish EUR covered bonds have been repriced.
The potential in the 2Y mortgage versus government spread looks, at least in the short run, somewhat exhausted. Even though the spread has tightened, the spread in funding costs through the repo market remains elevated (around 50-60bp). In our view this means that at current spread levels the incentive for repo-funded investors to switch into more short-dated covered bonds is weak. Thus we think that the 2Y mortgage versus government bond spread now trades closer to fair value. If the funding rates for mortgage bonds in the repo market were to improve, we would of course be willing to reconsider.
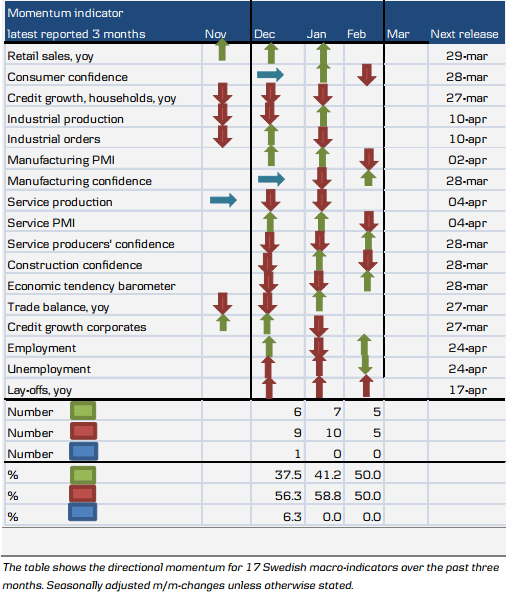
Another argument is that coming rate cuts by the Riksbank seem less likely in light of the more mixed domestic data. There is thus a risk that short rates could have a hard time trading down before at least the next Riksbank meeting.
Another important development has been the repricing of Swedish EUR covered bonds. ECB’s 3Y repos have meant a significant support for credit bonds through two channels. First, the excess liquidity in the system increases demand for bonds (carry trades). Also, as banks’ funding needs are well covered, issuance will go down sharply and as there are still huge uncertainties regarding southern European banks, we are not surprised to see a rally in Swedish EUR covered. The interesting thing from a Swedish perspective is that the cost disadvantage of issuing in EUR has decreased drastically. For instance, Stadshypotek last Wednesday issued a new 5Y EUR covered bond that when swapped back to SEK is close to levels where domestic benchmark bonds trade. We expect other banks to follow suit. Thus, we expect decreasing supply pressure in SEK.
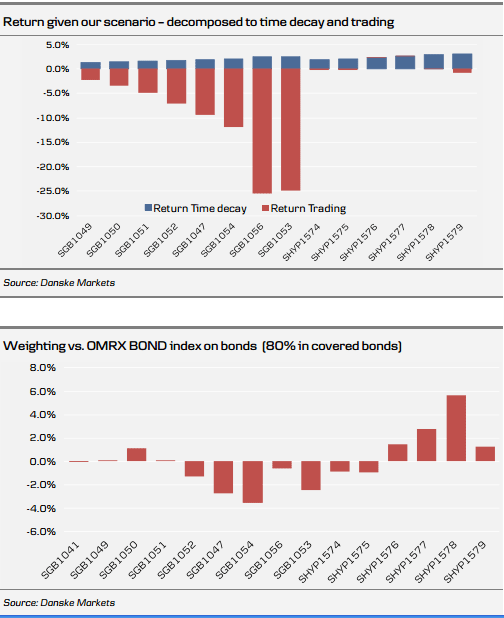
 We keep our overweight in mortgage bonds in our bond portfolio relative to the OMRXBOND index but choose to overweight longer mortgage bonds for the reasons we have mentioned above. Mortgage bonds account for 80% of our portfolio, while their index weight is 70%. This overweight translates into a shorter portfolio duration. The deviation is almost equal to 0.7Y. It is of course up to each portfolio manager to weigh his portfolio according to risk allocation, but we would generally characterize the deviation from index as relatively large. Also, our main point is the deviation relative index in the share of mortgage bonds.
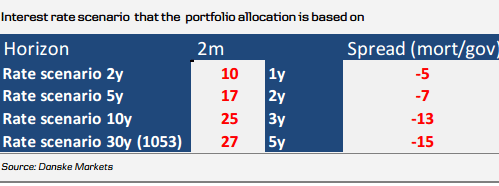
On a 2M horizon and given a rate scenario (see table) in which we expect higher rates and a steeper curve, the above weighting relative to index gives an annualized excess return of around 155bp (1.17% vs. -0.39% in the index).
Mortgage extensions relative to swaps also attractive
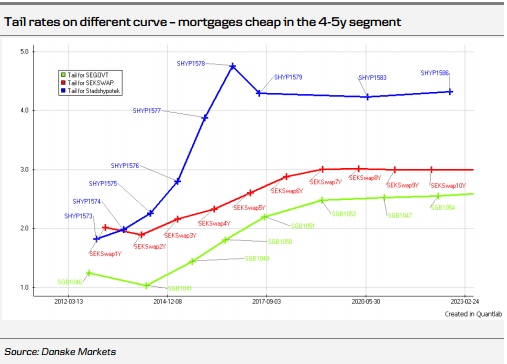
The chart below illustrates how steep the marginal curve is for mortgage bonds between the 2Y and 5Y segment. The question is how long this pricing can persist. We think that this could be used to hedge the bond portfolio against a continued sell-off in longer government bonds (which creates a steepening also further in on the curves), and to take position in a more long-term trade.
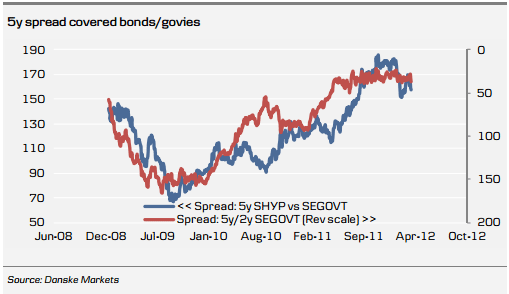
It is perhaps not obvious that the 5Y mortgage versus government bond spread correlates with the steepness of the government curve between 2Y and 5Y, but the diagram below is an indication of that. It is clear that trends in the government curve and in the mortgage versus government bond spread coincide. This is one of the reasons we are making adjustments to our model portfolio.
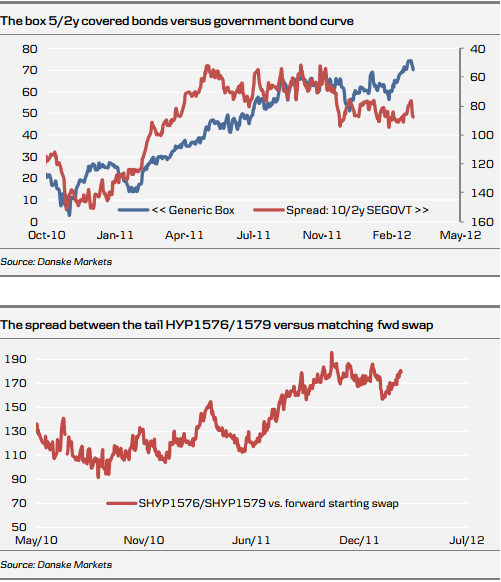
Another interesting observation is that the 5Y/2Y mortgage versus government box tends to flatten when the government curve steepens, i.e. longer mortgage bonds trade better relative to government bonds than shorter dated ones. Since we expect a gradual steepening of the yield curve it is natural to consider going further out on the mortgage curve. Note in the chart below that the 2Y-5Y mortgage vs. government bond box has flattened somewhat despite the fact that the government curve has steepened slightly. If the steepening continues it could have a large effect on the curve box.
 If the marginal pricing in mortgage bonds is striking relative to government bonds, it is even more so relative to swaps. Below we show an interesting trade, buying SHYP1579 versus SHYP1576 in a spread against a forward starting swap. It is clear that the spread between the marginal rates peaked at the end of 2011 when risk appetite collapsed. After a slight fall in the start of the year, the levels have edged up again. In our view the spread is attractive and has a good potential in the scenario we are looking at. It can be slightly difficult to transact in this kind of trade but we still find it interesting to look for loans that provide similar exposure. The spread implies a 2Y ASW spread in 3Y of +190bp. This should be compared to the current 2Y ASW spread for instance SHYP1575 ASW at +7.5bp. A substantial difference.

Short covered bonds have performed well since the start of the year, time for a pause. The risk to supply has diminished quite substantially since it has become much cheaper for mortgage institutions to issue on the EUR covered bond market.
Extensions along the covered bond curve versus matched forward starting swaps look attractive.
Trades
New, we recommend going further out on the curve in spreads covered bonds/govies.Buy SWH185 versus SGB1051 @ 153.5bp.
Profit taken, we collect profit in the 2y spread SWH166/SGB1041. Profit +14bp. We suggest moving further out on the curve instead, see above.
Loss taken, we take loss in the long position in 2y covered bonds outright. Loss -6bp. We keep our hedge (pay) FRAJUN12 for the time being, but recommend decreasing risk.

Time to overweight longer mortgage bonds in the portfolio
During the start of the year we have recommended being long short mortgage bonds relative to government bonds. We argued that upcoming rate cuts, which would keep down fixings, and the fact that there was little value left in short government bonds would translate in covered bond outperformance. It has so far been a pleasant journey being long short-dated covered bonds relative to government bonds. For instance SHW166 has provided an annualized return of +0.74%, whereas the matching government bond, SGB1041, has returned -0.30%. Honestly, however, longer mortgage bonds have outperformed government bonds even more but the return in longer mortgage bonds has outperformed government bonds even more but the return in longer mortgage bonds has been more or less the same as in shorter ones, despite lower risk. In terms of spreads relative to government bonds, shorter bonds have in any case been a better alternative.
 Risks associated with supply of covered bonds are more important in longer durations as most of the issuance is tilted towards the 5y point. During the beginning of the year there was a risk that the higher CCS level would prevent Swedish mortgage institutions from funding themselves in EUR due to the high relative cost. Now the CCS spread has tightened significantly and Swedish EUR covered bonds have been repriced.
 The potential in the 2Y mortgage versus government spread looks, at least in the short run, somewhat exhausted. Even though the spread has tightened, the spread in funding costs through the repo market remains elevated (around 50-60bp). In our view this means that at current spread levels the incentive for repo-funded investors to switch into more short-dated covered bonds is weak. Thus we think that the 2Y mortgage versus government bond spread now trades closer to fair value. If the funding rates for mortgage bonds in the repo market were to improve, we would of course be willing to reconsider.
Another argument is that coming rate cuts by the Riksbank seem less likely in light of the more mixed domestic data. There is thus a risk that short rates could have a hard time trading down before at least the next Riksbank meeting.
Another important development has been the repricing of Swedish EUR covered bonds. ECB’s 3Y repos have meant a significant support for credit bonds through two channels. First, the excess liquidity in the system increases demand for bonds (carry trades). Also, as banks’ funding needs are well covered, issuance will go down sharply and as there are still huge uncertainties regarding southern European banks, we are not surprised to see a rally in Swedish EUR covered. The interesting thing from a Swedish perspective is that the cost disadvantage of issuing in EUR has decreased drastically. For instance, Stadshypotek last Wednesday issued a new 5Y EUR covered bond that when swapped back to SEK is close to levels where domestic benchmark bonds trade. We expect other banks to follow suit. Thus, we expect decreasing supply pressure in SEK.
 We keep our overweight in mortgage bonds in our bond portfolio relative to the OMRXBOND index but choose to overweight longer mortgage bonds for the reasons we have mentioned above. Mortgage bonds account for 80% of our portfolio, while their index weight is 70%. This overweight translates into a shorter portfolio duration. The deviation is almost equal to 0.7Y. It is of course up to each portfolio manager to weigh his portfolio according to risk allocation, but we would generally characterize the deviation from index as relatively large. Also, our main point is the deviation relative index in the share of mortgage bonds.
 On a 2M horizon and given a rate scenario (see table) in which we expect higher rates and a steeper curve, the above weighting relative to index gives an annualized excess return of around 155bp (1.17% vs. -0.39% in the index).


Mortgage extensions relative to swaps also attractive
The chart below illustrates how steep the marginal curve is for mortgage bonds between the 2Y and 5Y segment. The question is how long this pricing can persist. We think that this could be used to hedge the bond portfolio against a continued sell-off in longer government bonds (which creates a steepening also further in on the curves), and to take position in a more long-term trade.
It is perhaps not obvious that the 5Y mortgage versus government bond spread correlates with the steepness of the government curve between 2Y and 5Y, but the diagram below is an indication of that. It is clear that trends in the government curve and in the mortgage versus government bond spread coincide. This is one of the reasons we are making adjustments to our model portfolio.

Another interesting observation is that the 5Y/2Y mortgage versus government box tends to flatten when the government curve steepens, i.e. longer mortgage bonds trade better relative to government bonds than shorter dated ones. Since we expect a gradual steepening of the yield curve it is natural to consider going further out on the mortgage curve. Note in the chart below that the 2Y-5Y mortgage vs. government bond box has flattened somewhat despite the fact that the government curve has steepened slightly. If the steepening continues it could have a large effect on the curve box.
 If the marginal pricing in mortgage bonds is striking relative to government bonds, it is even more so relative to swaps. Below we show an interesting trade, buying SHYP1579 versus SHYP1576 in a spread against a forward starting swap. It is clear that the spread between the marginal rates peaked at the end of 2011 when risk appetite collapsed. After a slight fall in the start of the year, the levels have edged up again. In our view the spread is attractive and has a good potential in the scenario we are looking at. It can be slightly difficult to transact in this kind of trade but we still find it interesting to look for loans that provide similar exposure. The spread implies a 2Y ASW spread in 3Y of +190bp. This should be compared to the current 2Y ASW spread for instance SHYP1575 ASW at +7.5bp. A substantial difference.


