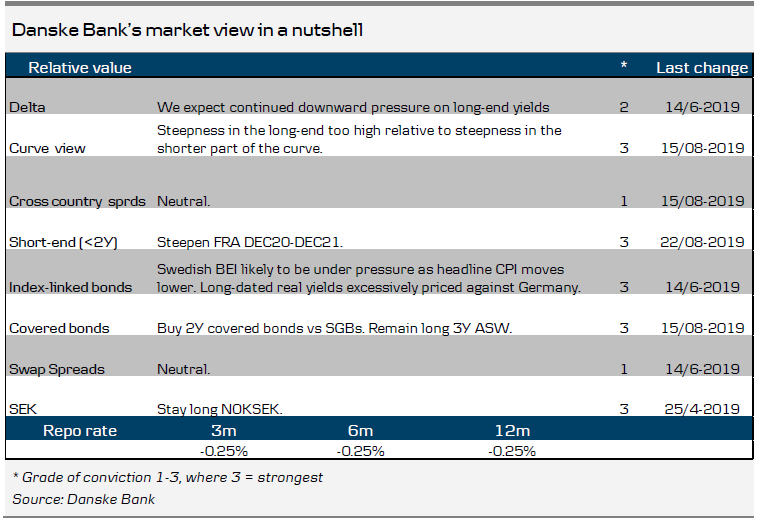
Trades
New, steepen FRA DEC20/DEC21 @ +2.5bp. P/L: +12/-5bp.
Job market hits the break
After a mostly quiet week, data releases next week are the final pieces of information for the Riksbank ahead of the 4 September policy meeting (policy announcement the day after).
Of the statistics released we would say that the most important one is the NIER business and consumer confidence surveys and in particular business confidence since the survey covers the entire private business sector; manufacturing, retail trade, services industries and construction.
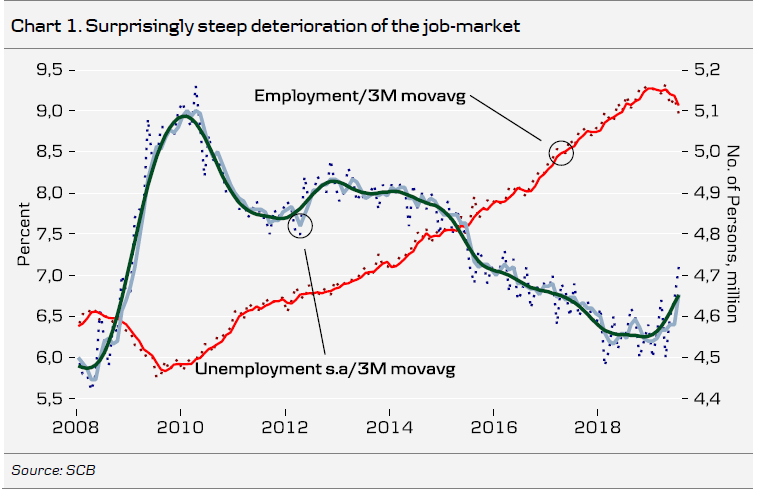
And of all the numbers in the survey we would now pay special attention to labour market indicators. Yesterday we got hard labour market data for July. June unemployment jumped which is perfectly natural if one looks at unadjusted data though adjusted unemployment picked up too. In any case we (and everyone else we guess) were looking for a correction (lower) in July. That did not happen. Unemployment jumped again. From time to time these things happen as a result of inflows to the labour force. Not this time around, the labour force was basically unchanged. Instead employment registered another drop.

One can always claim that these data around summer are unreliable. Maybe so but the thing is that basically all job-market indicators point in the same direction. Hiring plans are lower and overtime hours dropping fast (see last week’s RtM Sweden). Vacancies are off peak and temporary employment is in decline. Employers scaling back on overtime and temporary workers are significant early indicators.
The labour market is at the core of the Riksbank’s thinking. Strong labour market/high resource utilisation leads to higher wages and at the end inflation. Of course it works the other way around too. Looking at the chart below it appears reasonable to say that the RB’s July unemployment forecast needs some adjustment
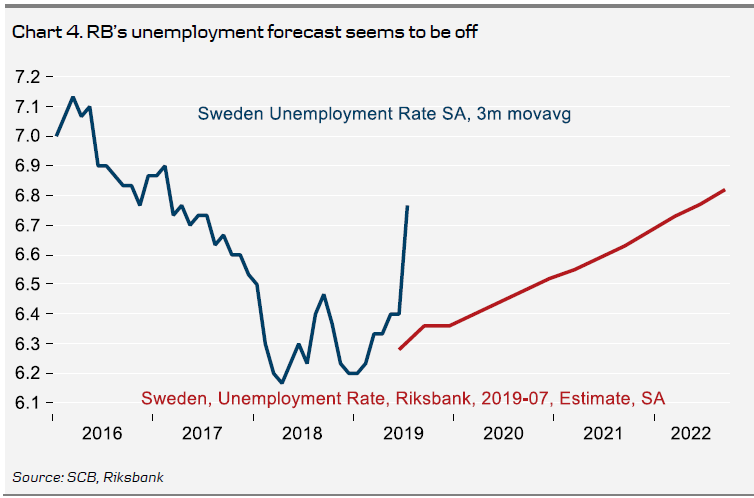
We think it is time for the RB to make a more fundamental review of the policy strategy. Pushing out the next hike by a quarter (the typical adjustment historically) may very well not be enough. In fact we would not be surprised if at least one board member (Jansson) will discuss whether the next move will be a rate cut rather than a hike.
Long end of the FRA curve extremely flat
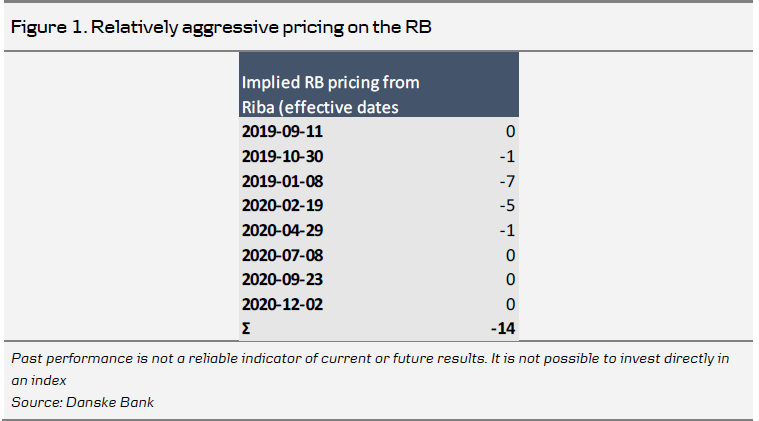
As international rates have moved lower and domestic data continues to deteriorate (not least the crucial labour market data), the FRA curve has evolved into a bath-tub type shape. Pricing on the RB has become relatively aggressive by any standards, with some 14bp in cuts expected over the coming year. Some 8bp are expected up until the December 2019 meeting, perhaps a tad aggressive in our view. However, given the significant deterioration in data and other risks (such as a hard Brexit) we are not keen to go against that.
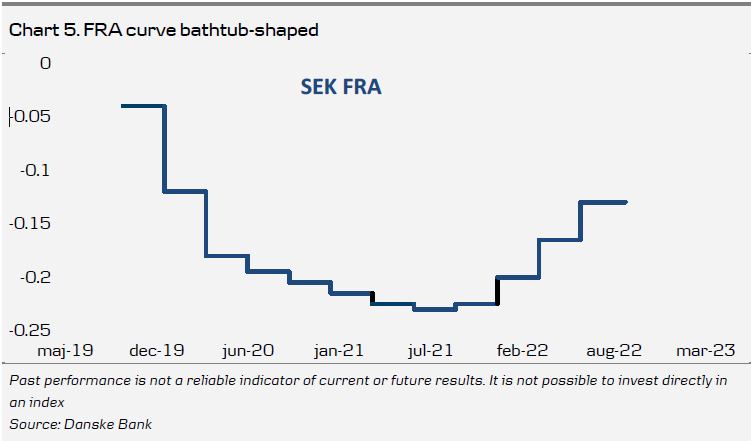
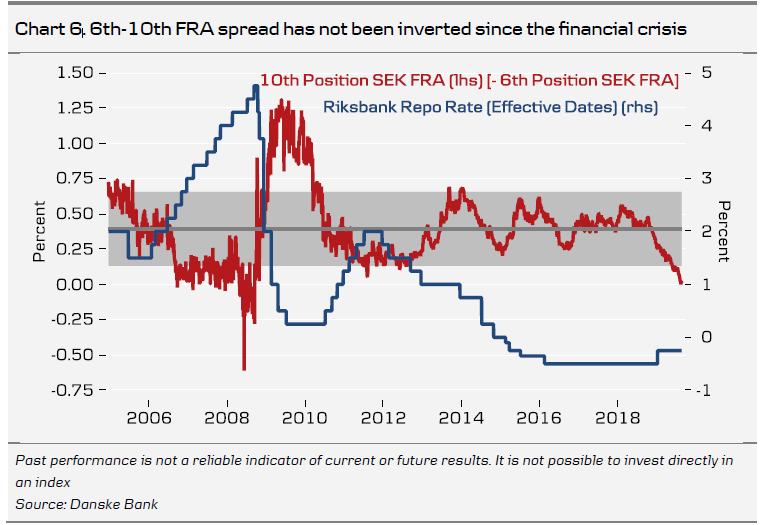
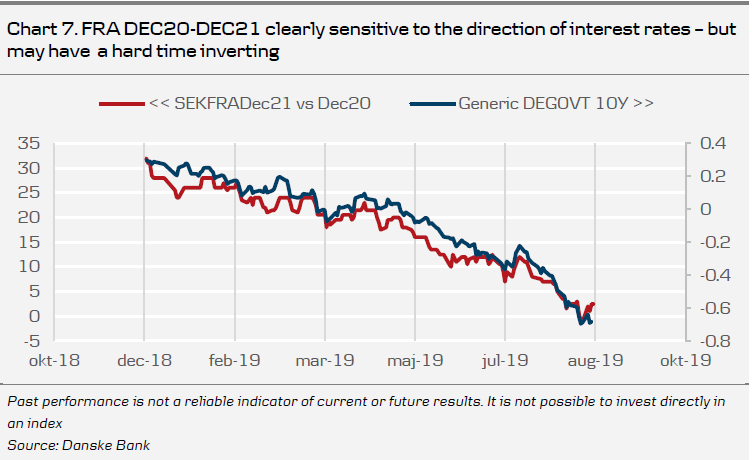
Also striking is the extreme flatness further out on the FRA curve. For instance, the DEC 2021 vs DEC2020 trades at a measly +2.5bp spread. Historically, the FRA curve has not inverted so far out on the curve since the financial crisis, see chart below. Thus, we reason that there should be a resistance to inverting the FRA curve so far out. This should especially be the case in an environment where the potential for rate cuts appears limited. We take some comfort from the fact that so far rate cut expectations have been concentrated to late 2019 and early 2020.
A rate cut in the near future is likely to be neutral or slightly positive for the DEC 2021 vs DEC 2020 spread. This is no doubt a trade with a bearish tilt when it comes to international rates. However, as we like the risk-reward and it could help balance up more rate bullish trades, we add the trade to our portfolio of recommendations. We set the P/L levels to 12/-5bp.
SEK: when (not why) does the SEK weaken?
After having traded relatively strongly (or more like it, not as weakly as we have been accustomed to) during the first half of summer, the SEK has once again reverted to the same old rut as the global cyclical outlook (on the back of the trade war escalation) has once again darkened, and the small rebound we saw up until the end of July has been erased. Just the other day, USD/SEK took out a new 17-year high, briefly trading above 9.73: the highest level since mid-2002. Thus far into 2019 we have seen the SEK weaken by c.9% vs the USD and almost 6% vs the EUR. We have previously emphasised some fundamental factors that, on top of the ultra-easy monetary policy conducted by the Riksbank, could explain the last couple of years’ trendwise decline in the SEK, see for example FX Strategy: Hardships for the SEK, 13 May 2019. This time, however, we would like to take a different perspective. Instead of ‘why’, we ask ‘when’ does the SEK weaken? To tackle this question, we make use of intraday data and split the day into four time zones: Asian time (00-08 CET), European time (08-16), US time (16-00) and a distinct time zone overlapping European and US time (13-18, dubbed ‘crossover’). Then we analyse how the SEK has performed during each time zone, as shown below.
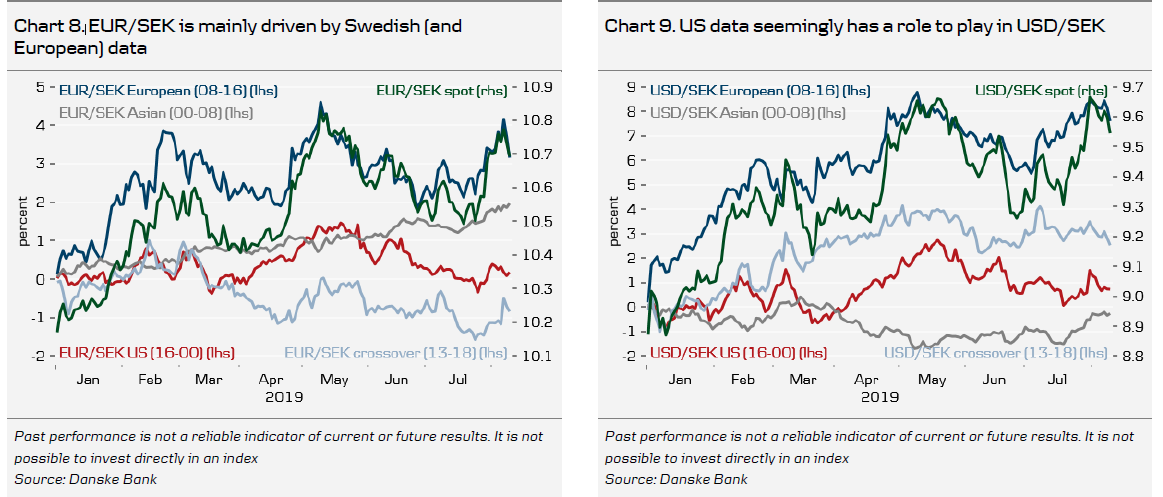
To start with, we note that both EUR/SEK and USD/SEK seem primarily driven by European time, as evident by the strong covariation with the actual spot level (green lines). Digging even deeper and comparing the performance during European time with the EUUS overlapping ‘crossover’ period, an interesting pattern emerges: it seems that EUR/SEK primarily strengthens before noon (European time). What is going on during these hours that could possibly explain this pattern? As a matter of fact, Swedish (and European) economic data is for the most part released before noon, which could suggest that a lot of the depreciation of the SEK vs the EUR we have seen thus far in 2019 is driven by economic data, which makes sense intuitively.
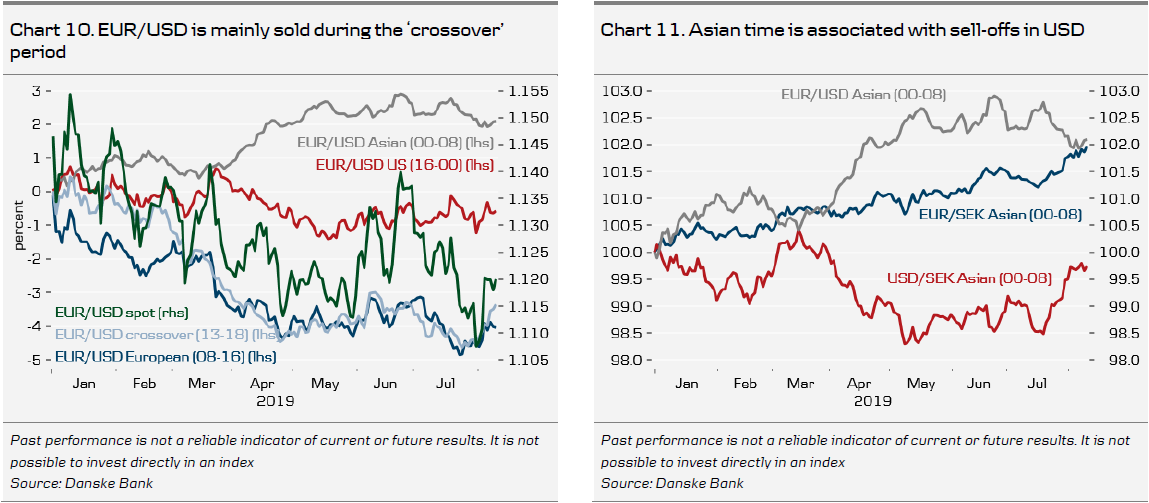
During US time, the appreciation of EUR/SEK fades and actually reverses marginally. During Asian time it is back on, though less so than during European time. A similar pattern can be noted in USD/SEK, where the SEK-weakening is concentrated to European time, mainly before noon even though it continues during early US-time as well. It is still the case that USD/SEK appreciates more during European time than US time. This pattern is also at least somewhat consistent with the thought of SEK being driven by primarily economic data. Something else that is noteworthy is that USD/SEK has actually weakened during Asian time throughout the year. Why is that? To make an attempt to answer that question, we have to expand the analysis to encompass EUR/USD as well.
Studying the above charts, an interesting pattern emerges: Asian time is associated with selling USD, especially vs EUR but also (at least earlier in the year) vs SEK. Despite EUR/USD being down c.2.5% YTD (green line), we note that in the chart to the right EUR/USD is actually up c.2% in Asian time! This is however countered by an even greater disposition to buy USD during European afternoons (see ‘crossover’) which intuitively could point towards US data being a factor. The tendency to sell USD during Asian time is actually so strong that even the SEK has performed (albeit marginally) vs USD during this time. Given how ill the SEK has fared against the USD in general, we find this rather remarkable.
Judging by the analysis thus far, most of the action happens during European time, with some overlap to US time before noon (up until 18:00 CET). With this in mind, let us therefore scrutinise these periods even further.
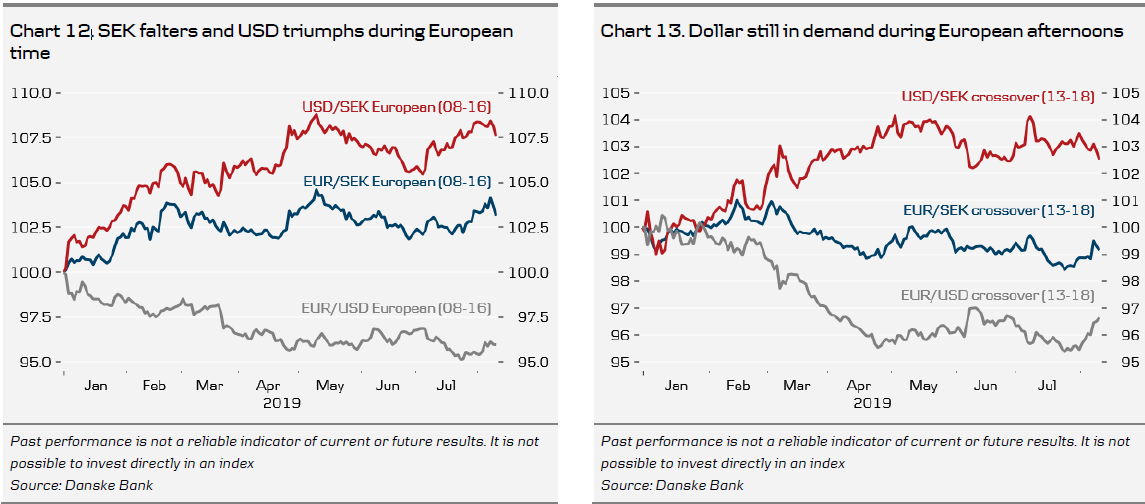
Hopefully, this further emphasises the patterns we have previously outlined. EUR/SEK has risen c.3% YTD during European time, but is down almost 1% after noon. This makes us conclude that EUR/SEK is primarily a European matter, driven by data, and somewhat boosted by further EUR-buying during Asian time. As for USD/SEK, the picture is even more unambiguous: SEK is sold both during European and US time.
The only relief for the SEK vs USD has been during Asian time, but this has been reversed to some extent in the last month or so. EUR/USD, on the other hand, has been a screaming sell throughout European time, including the ‘crossover’ period. The one instance that EUR/USD is bought is during Asian time.
To sum up:
Feel free to reach out to us if you wish to discuss these findings further.
