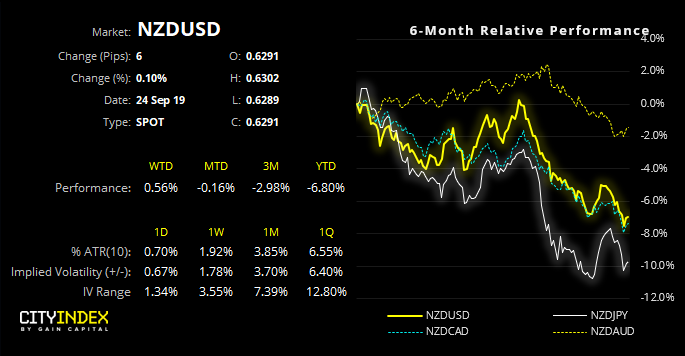
RBNZ are expected to hold tomorrow, which could leave potential for NZD crosses to bounce is there’s no easing bias in their statement.
Unless of course RBNZ want to throw another curveball and cut another 25 bps. On the 7th August, RBNZ went above and beyond with a 50-bps cut, catching many off-guard who were expecting a 25-bps of easing. Yet this aggressive stance is also why many expect for RBNZ hold tomorrow and await further data.

Currently the 1-month OIS is suggesting a mere 11% chance of a cut tomorrow and all economists polled by Reuters expect RBNZ to hold this month. GDP beat expectations last week and their TWI trades at a 4-year low, beneath their projection of 73 laid out in August’s monetary policy statement (ie good for exports and inflation). Therefore, a neutral hold and bounce for NZD is a potential scenario. That said, RBNZ aren’t known to mince their words so any dovish elements in tomorrow’s statement could see NZD extend their losses if traders suspect another cut may be on the horizon.
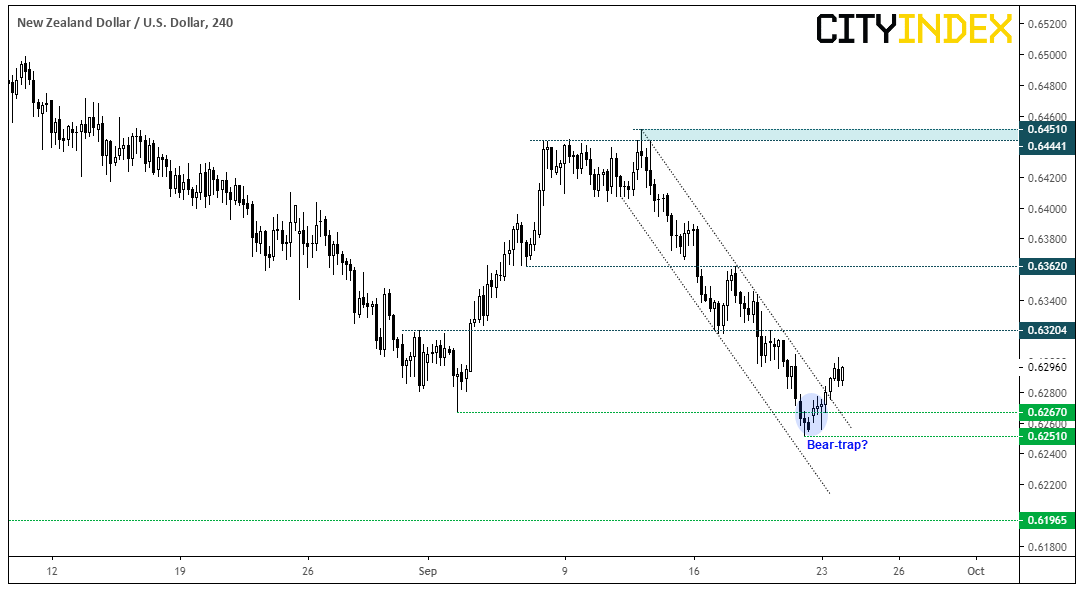
NZD/USD has recently broken above its bearish channel on the four-hour chart. Furthermore, a 2-bar bullish reversal pattern has appeared on the daily timeframe to suggest Friday’s bearish close was a bear-trap.

With that said, NZD/USD may not be the best pair to trade counter trend unless we see bearish follow through on the US dollar coupled with a neutral hold later from RBNZ. Yet with it breaking its four-hour channel whilst other NZD pairs remain within them, we’re monitoring NZD/USD closely to see if it will be a leading pair for further NZD strength, or simply got ahead of itself and is due further losses.
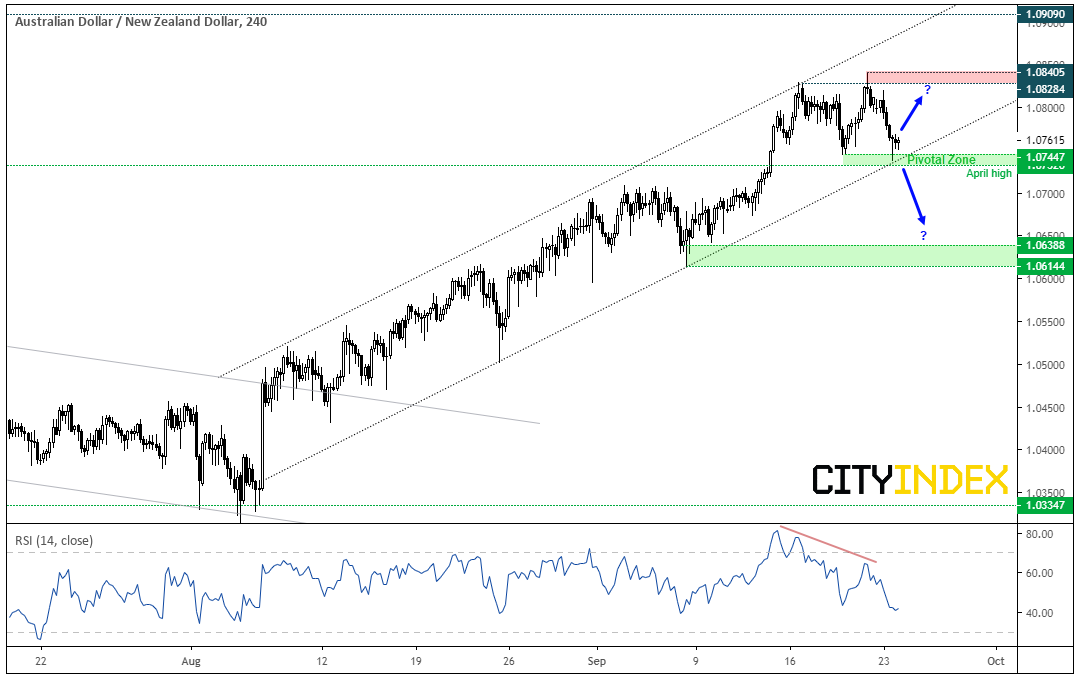
AUD/NZD trades within a bullish channel on the four-hour chart, although price action is trying to carve out pattern reminiscent to a double top. Furthermore, bearish divergence has formed with the RSI. Indeed, if we’re to see a (relatively) neutral hold) tomorrow, we could see NZD strengthen and break through key support to confirm a double top pattern.
- 1.0732 – 1.0745 is a pivotal zone comprising of the lower channel and April high; so, it could act as a springboard for the next leg higher, or confirm a double top
- If successful the double top pattern projects an approximate target around, 1.0650
- If the channel holds, bulls could look to target the highs around 1.0828 – 1.0840
- Take note that RBA’s Governor Philip Lowe is due to speak later, so any dovish comments from him along with a neutral hold from RBNZ tomorrow could see this pair crash lower.

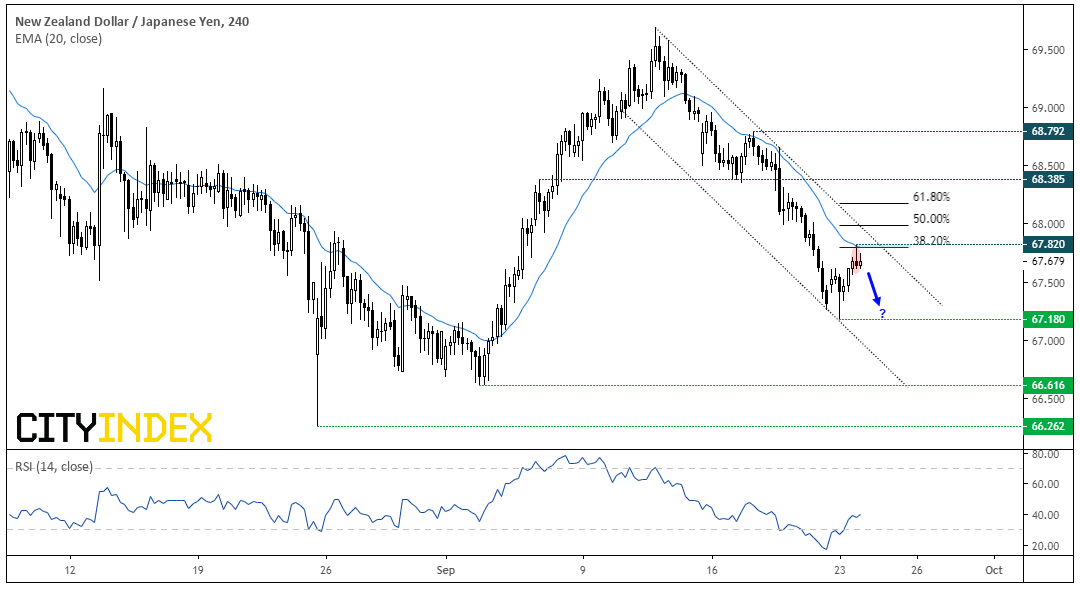
NZD/JPY remains within a bearish channel and has currently found resistance around the 38.2% Fibonacci level and 20-day eMA. Given the bearish structure we’d prefer to seek bearish setups whilst it remains within the bearish channel. Even if the channel were to break, we’d want a more compelling argument before seeking long setups.
- RSI is no longer oversold and, as there is no bearish divergence with price action, we see the potential for NZD/JPY to have another crack at the lows.
- A bearish pinbar has formed around the 20-day eMA and 38.2% Fibonacci level. However, as volumes are low and economic data is light, it leaves potential for more indecisive candles to form around current levels. Therefore, bears could look for bearish range expansion to form before assuming a high is in.
- Whilst the four-hour trend remains bearish below 68.78, we’d step aside if prices break above the upper channel.
