AUD/USD punched above 0.97 yesterday during US trading hours after price rose spectacularly during US hours with the sudden decline in USD despite a rise in US stocks. 0.97 ceiling, which is also the the high of last week’s trading range. However price failed to test 0.98 in any way, with price quickly fall back to 0.97 once more during today’s Asian session.
Hourly Chart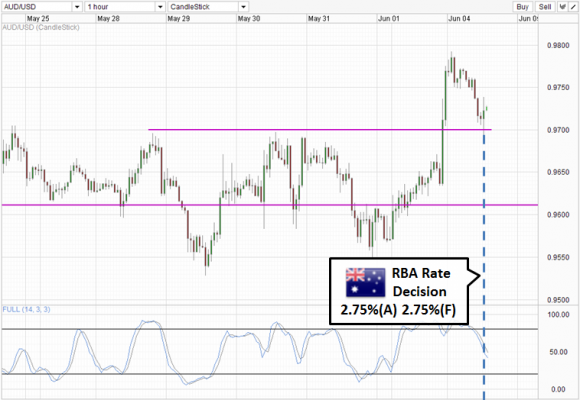 AUD/USD_1" title="AUD/USD_1" width="580" height="400">
It is not surprising to see price trading lower as overall trend remains bearish with the decline from 1.06 continuing to be in play (see weekly chart below). Couple that with the fact that the move was USD driven with a new correlation behavior, and a strong move of around 200 pips within 24 hours, sets the stage for a strong pullback. Hence a move back to 0.97 can’t be described as unexpected, but rather 0.97 holding on nicely is a pleasant surprise for the bulls. Price was trading towards and dipped below 0.97 just a little bit, but the RBA decision (or rather non-decision) to hold cash rates at 2.75% pulled price higher.
Now the question is whether price will be able to move towards 0.98, or head below 0.97 AFTER RBA has given bulls a gentle nudge in the direction that they want. For a move back towards 0.98, a break of 0.975 interim support turned resistance is key for price to establish its bullish intent. In similar vein, a break of 0.97 despite the push signals that bears are still mostly in charge, and the previous rally only served to provide better price for bears to sell into. We could potentially see acceleration towards 0.96 and potentially beyond quickly should that happens, especially since Stochastic indicator tells us that a bear trend is still underway.
Weekly Chart
Things cannot be anymore different from the Weekly Chart. Price is currently rebounding from the 0.96 level which has been in play since October 2011. Stochastic indicator is also hinting that a bull cycle is coming with a Stoch/Signal cross within the Oversold region (the signal is only ready when stoch line crosses above 20.0). If this 0.96 level hold, a move towards 1.01 becomes possible. However it is worth noting that the current support region stretches all the way to slightly below 0.94, hence in theory price could still head lower this week without impacting the potential of a bullish reversal. As such, traders may wish to wait for more confirmation for a case of bullish reversal as current candlestick pattern can be hardly regarded as a strong bullish pattern.
Fundamentally, it is interesting to see RBA continuing to say that “inflation may provide a scope to ease”, a phrase that they have been using since the start of this year. Furthermore, Governor Stevens is still claiming that AUD is “excessively high” despite a 10 cent move lower, breaking parity with NZD in the process. This will continue to encourage short speculators to hold onto their short positions in search of another rate cut in 2013. With GDP figure coming tomorrow, it will be worth noting the reaction of price especially if the GDP print is higher than expected. If price collapses after initial rally, the underlying bears will be extremely strong and it will be highly risky to bet that 0.96 will hold, if it is still there to begin with that is.
- English (UK)
- English (India)
- English (Canada)
- English (Australia)
- English (South Africa)
- English (Philippines)
- English (Nigeria)
- Deutsch
- Español (España)
- Español (México)
- Français
- Italiano
- Nederlands
- Português (Portugal)
- Polski
- Português (Brasil)
- Русский
- Türkçe
- العربية
- Ελληνικά
- Svenska
- Suomi
- עברית
- 日本語
- 한국어
- 简体中文
- 繁體中文
- Bahasa Indonesia
- Bahasa Melayu
- ไทย
- Tiếng Việt
- हिंदी
RBA Holds Rate – 0.97 Safe For now
Latest comments
Loading next article…
Install Our App
Risk Disclosure: Trading in financial instruments and/or cryptocurrencies involves high risks including the risk of losing some, or all, of your investment amount, and may not be suitable for all investors. Prices of cryptocurrencies are extremely volatile and may be affected by external factors such as financial, regulatory or political events. Trading on margin increases the financial risks.
Before deciding to trade in financial instrument or cryptocurrencies you should be fully informed of the risks and costs associated with trading the financial markets, carefully consider your investment objectives, level of experience, and risk appetite, and seek professional advice where needed.
Fusion Media would like to remind you that the data contained in this website is not necessarily real-time nor accurate. The data and prices on the website are not necessarily provided by any market or exchange, but may be provided by market makers, and so prices may not be accurate and may differ from the actual price at any given market, meaning prices are indicative and not appropriate for trading purposes. Fusion Media and any provider of the data contained in this website will not accept liability for any loss or damage as a result of your trading, or your reliance on the information contained within this website.
It is prohibited to use, store, reproduce, display, modify, transmit or distribute the data contained in this website without the explicit prior written permission of Fusion Media and/or the data provider. All intellectual property rights are reserved by the providers and/or the exchange providing the data contained in this website.
Fusion Media may be compensated by the advertisers that appear on the website, based on your interaction with the advertisements or advertisers.
© 2007-2025 - Fusion Media Limited. All Rights Reserved.