
Raytheon Company (NYSE:RTN) reported fourth-quarter 2017 adjusted earnings from continuing operations of $2.03 per share, beating the Zacks Consensus Estimate of $2.02 by 0.5%.
The company’s reported earnings of $1.35 per share came in below the prior-year quarter’s equivalent of $1.88, owing to the Tax Cuts and Job Acts of 2017, which had an unfavorable impact of 59 cents on earnings. Also, pre-tax discretionary pension plan contribution had an unfavorable tax-related impact of 9 cents on earnings.
Raytheon Company Price, Consensus and EPS Surprise
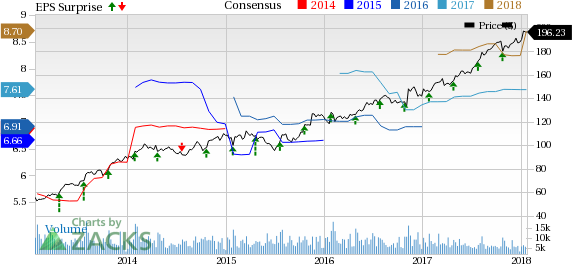
Raytheon Company Price, Consensus and EPS Surprise | Raytheon Company Quote
Operational Performance
The company’s fourth-quarter revenues of $6,783 million witnessed 8% year-over-year growth. The reported number however missed the Zacks Consensus Estimate of $6,833.7 million by 0.7%.
Raytheon’s bookings in the fourth quarter were $8,541 million compared with $7,582 million in the year-ago quarter, reflecting a rise of 12.6%. Total backlog at the end of 2017 was $38.2 billion, compared to $36.7 billion at the end of 2016.
Total operating expenses increased 9.5% to $5,913 million in the fourth quarter. Operating income of $870 million dropped 1.1% from $880 million a year ago.
Segmental Performance
Integrated Defense Systems: The segment’s revenues grew 6% year over year to $1,553 million due to higher sales on an international early-warning radar program. Operating income increased to $247 million from $238 million.
Intelligence, Information and Services: The segment’s revenues of $1,572 million were higher than the year-ago level of $1,516 million by 4%. Operating income in the reported quarter dropped to $117 million from $120 million a year ago.
Missile Systems: Segment revenues grew 15% to $2,185 million from $1,897 million a year ago, driven by higher net sales on the Advanced Medium-Range Air-to-Air Missiles, Standard Missile-3 and Paveway programs. Operating income improved to $278 million from $261 million a year ago.
Space and Airborne Systems: Revenues in the quarter improved 4% to $1,670 million. Operating income rose 10% to $242 million.
Forcepoint: This commercial cyber-security segment generated net sales of $156 million in the fourth quarter, up from $143 million a year ago. The joint-venture entity registered operating loss of $8 million in the reported quarter, compared to the year-ago operating income figure of $21 million.
Financial Update
Raytheon ended 2017 with cash and cash equivalents of $3,103 million, down from $3,303 million as of Dec 31, 2016. Long-term debt was $4,750 million, down from an outstanding debt of $5,335 million as of Dec 31, 2016.
Operating cash flow from continuing operations was $2.7 billion at the end of 2017 compared with $2,852 billion at the end of 2016.
In 2017, Raytheon repurchased 4.9 million shares of common stock for $800 million.
Guidance
Raytheon expects to generate net sales in the range of $26.4-$26.9 billion in 2018 and earnings per share in the range of $9.55-$9.75. The company also issued its cash flow from operating activities guidance in the range of $3.6-$4 billion during 2018.
Zacks Rank
Raytheon currently sports a Zacks Rank #1 (Strong Buy). You can see the complete list of today’s Zacks #1 Rank stocks here.
Recent Peer Release
General Dynamics Corporation (NYSE:GD) reported fourth-quarter 2017 earnings from continuing operations of $2.50 per share, beating the Zacks Consensus Estimate of $2.37 by 5.5%. However, its total revenues of $8,277 million missed the Zacks Consensus Estimate of $8,437 million by 1.9%.
Upcoming Peer Release
Huntington Ingalls Industries, Inc. (NYSE:HII) is expected to report fourth-quarter 2017 results on Feb 15. The company has an Earnings ESP of +3.43% and a Zacks Rank #2 (Buy).
Lockheed Martin Corp. (NYSE:LMT) is expected to report fourth-quarter 2017 results on Jan 29. The company has an Earnings ESP of +0.31% and a Zacks Rank #2.
Today's Stocks from Zacks' Hottest Strategies
It's hard to believe, even for us at Zacks. But while the market gained +18.8% from 2016 - Q1 2017, our top stock-picking screens have returned +157.0%, +128.0%, +97.8%, +94.7%, and +90.2% respectively.
And this outperformance has not just been a recent phenomenon. Over the years it has been remarkably consistent. From 2000 - Q1 2017, the composite yearly average gain for these strategies has beaten the market more than 11X over. Maybe even more remarkable is the fact that we're willing to share their latest stocks with you without cost or obligation.
See Them Free>>
General Dynamics Corporation (GD): Free Stock Analysis Report
Lockheed Martin Corporation (LMT): Free Stock Analysis Report
Huntington Ingalls Industries, Inc. (HII): Free Stock Analysis Report
Raytheon Company (RTN): Free Stock Analysis Report
Original post
Zacks Investment Research